The new CF2GO: efficiency of photosynthesis measured with scientific accuracy
In June 2025, we launched the CF2GO (Chlorophyll Fluorescence 2 Go) at the Greentech in Amsterdam, where the jury nominated it for the innovation award out of 47 products.
The CF2GO is a system that accurately measures how efficiently a crop uses light for photosynthesis, in real time and from up to a meter away from the crop. No leaf clips, and not touching the plants.
It brings the same scientific quality as our lab systems into the greenhouse. The CF2GO can hang in a fixed spot or move along a rail or boom, and it is already running at several commercial growers.
Johan Langelaan, cultivation manager at Maarel Orchids, explains why they use it: "We can now see in real-time when the plants require more or less light for photosynthesis, allowing us to adjust screening and lighting immediately." And: "You get hard facts and measured values from the system, and you can immediately see what they mean." (https://www.onderglas.nl/gewas-krijgt-exact-de-hoeveelheid-licht-die-het-nodig-heeft/)


Figure 1: Two of the CF2GO's mounted in two different commercial greenhouses.
What is chlorophyll fluorescence?
When a leaf absorbs light, that energy can go three ways. Most of it is used for photosynthesis. Some is released as heat, and a few percent comes back as red light: chlorophyll fluorescence. You can't see it by eye, but a camera with the right filter can.
The three routes of energy are in direct competition. When less energy goes to photosynthesis, more goes to heat and fluorescence. That is why the fluorescence signal tells us how well photosynthesis is running. (More in our introduction to chlorophyll fluorescence:
https://www.phenovation.com/introduction-to-chlorophyll-fluorescence)

How does the CF2GO measure it?
The CF2GO gives the plant one short, very bright flash of light, about 6,500 µmol m⁻² s⁻¹ at 1 meter (roughly three times full sunlight). The flash lasts about a second, and does not harm the plant.
At the start of the flash, the fluorescence is at its lowest. As the photosystems fill up with energy, the fluorescence rises to a maximum. The CF2GO captures that rise, which is called the OJIP curve, and calculates more than 20 parameters from it. (For more information see OJIP part 1 and 2: https://www.phenovation.com/ojip and https://www.phenovation.com/chlorophyll-fluorescence-measuring-methods-ojip-part-2)
Think of it as a fitness test for the plant, like for an athlete. How fit the plant is depends on its conditions, stress, and how well the photosynthetic system is working.


What it looks like in practice
Stress, before you see it on the plant
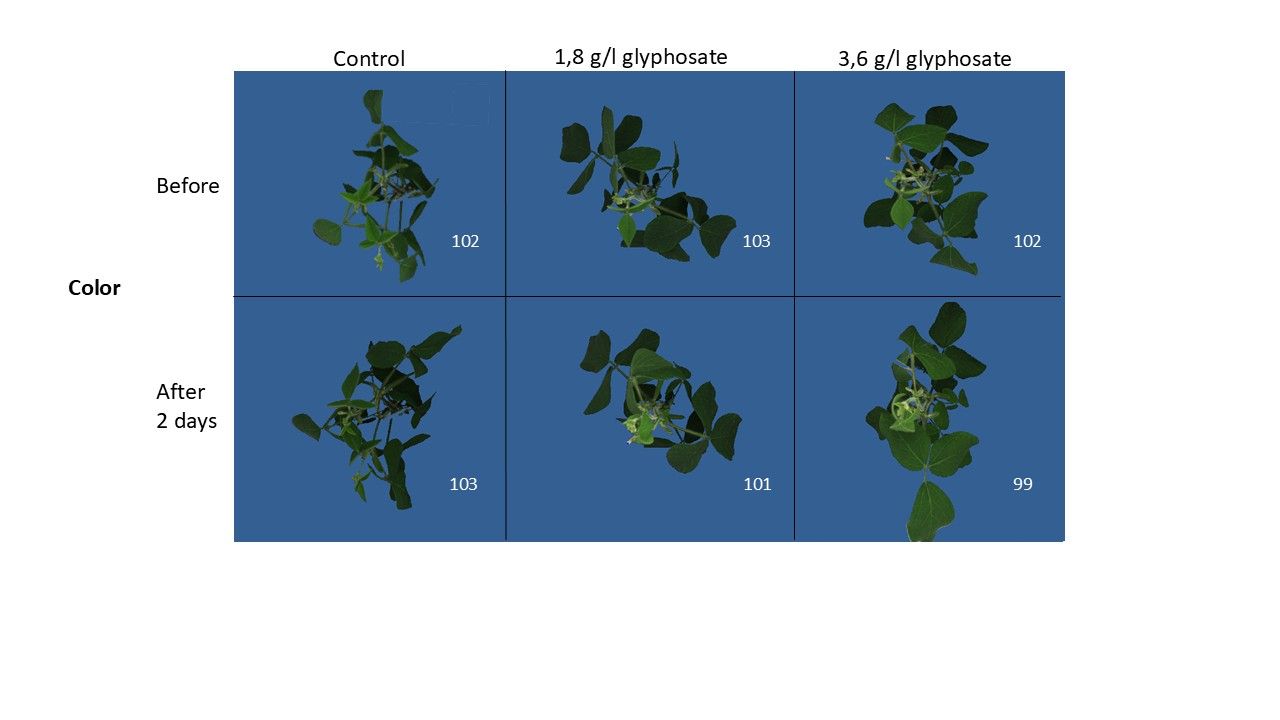
To demonstrate what chlorophyll fluorescence can do, we sprayed soybean plants with glyphosate (a strong herbicide that kills the plant). Already on the second day, the efficiency of photosynthesis dropped significantly. NPQ (heat release) went up and ETR (electron transport rate) went down. The plants still looked fine by eye (and RGB imaging). Yellowing of the leaves began after four days.
Ofcourse, glyphosate kills a plant, so this is an extreme case. But for stress you can fix, like too much light, drought or heat, that early signal gives a window to act.


Phalaenopsis in the afternoon
Phalaenopsis is a CAM plant, meaning it takes up CO₂ at night and stores it in the form of malate, so that it can be used during the day. The plant does this, so that it can close its stomata during the day, helping to save water when it is hot.
In a climate cabinet with constant light, the efficiency of photosynthesis of healthy phalaenopsis plants dropped at the end of the day (Figure 2). This was due to the malate reserves running out. The plant did not have enough CO2 to produce sugars, which is why the efficiency dropped.
When we dimmed the lights in steps, the efficiency did not drop. This means much energy was saved by dimming the lights in the afternoon, when the plant did not use the light anyways (it could even be harmful).

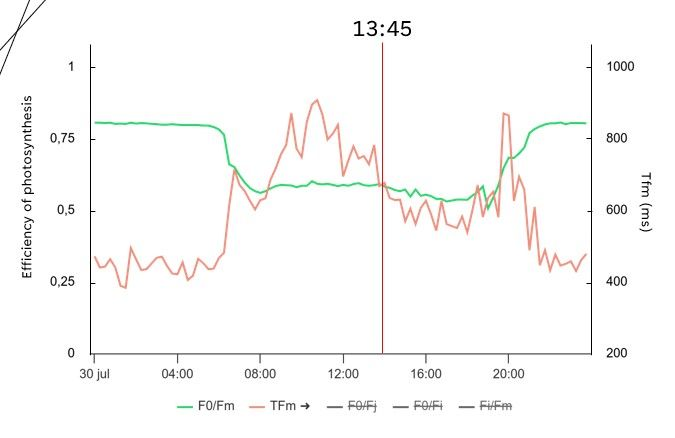
In a commercial phalaenopsis greenhouse, we saw the same afternoon dip (Figure 3). And, before efficiency dropped, TFm, which is the time to maximum fluorescence, started dropping one hour earlier (meaning the plant could already handle less light). This gave the grower an early signal to screen more or dim the lights.
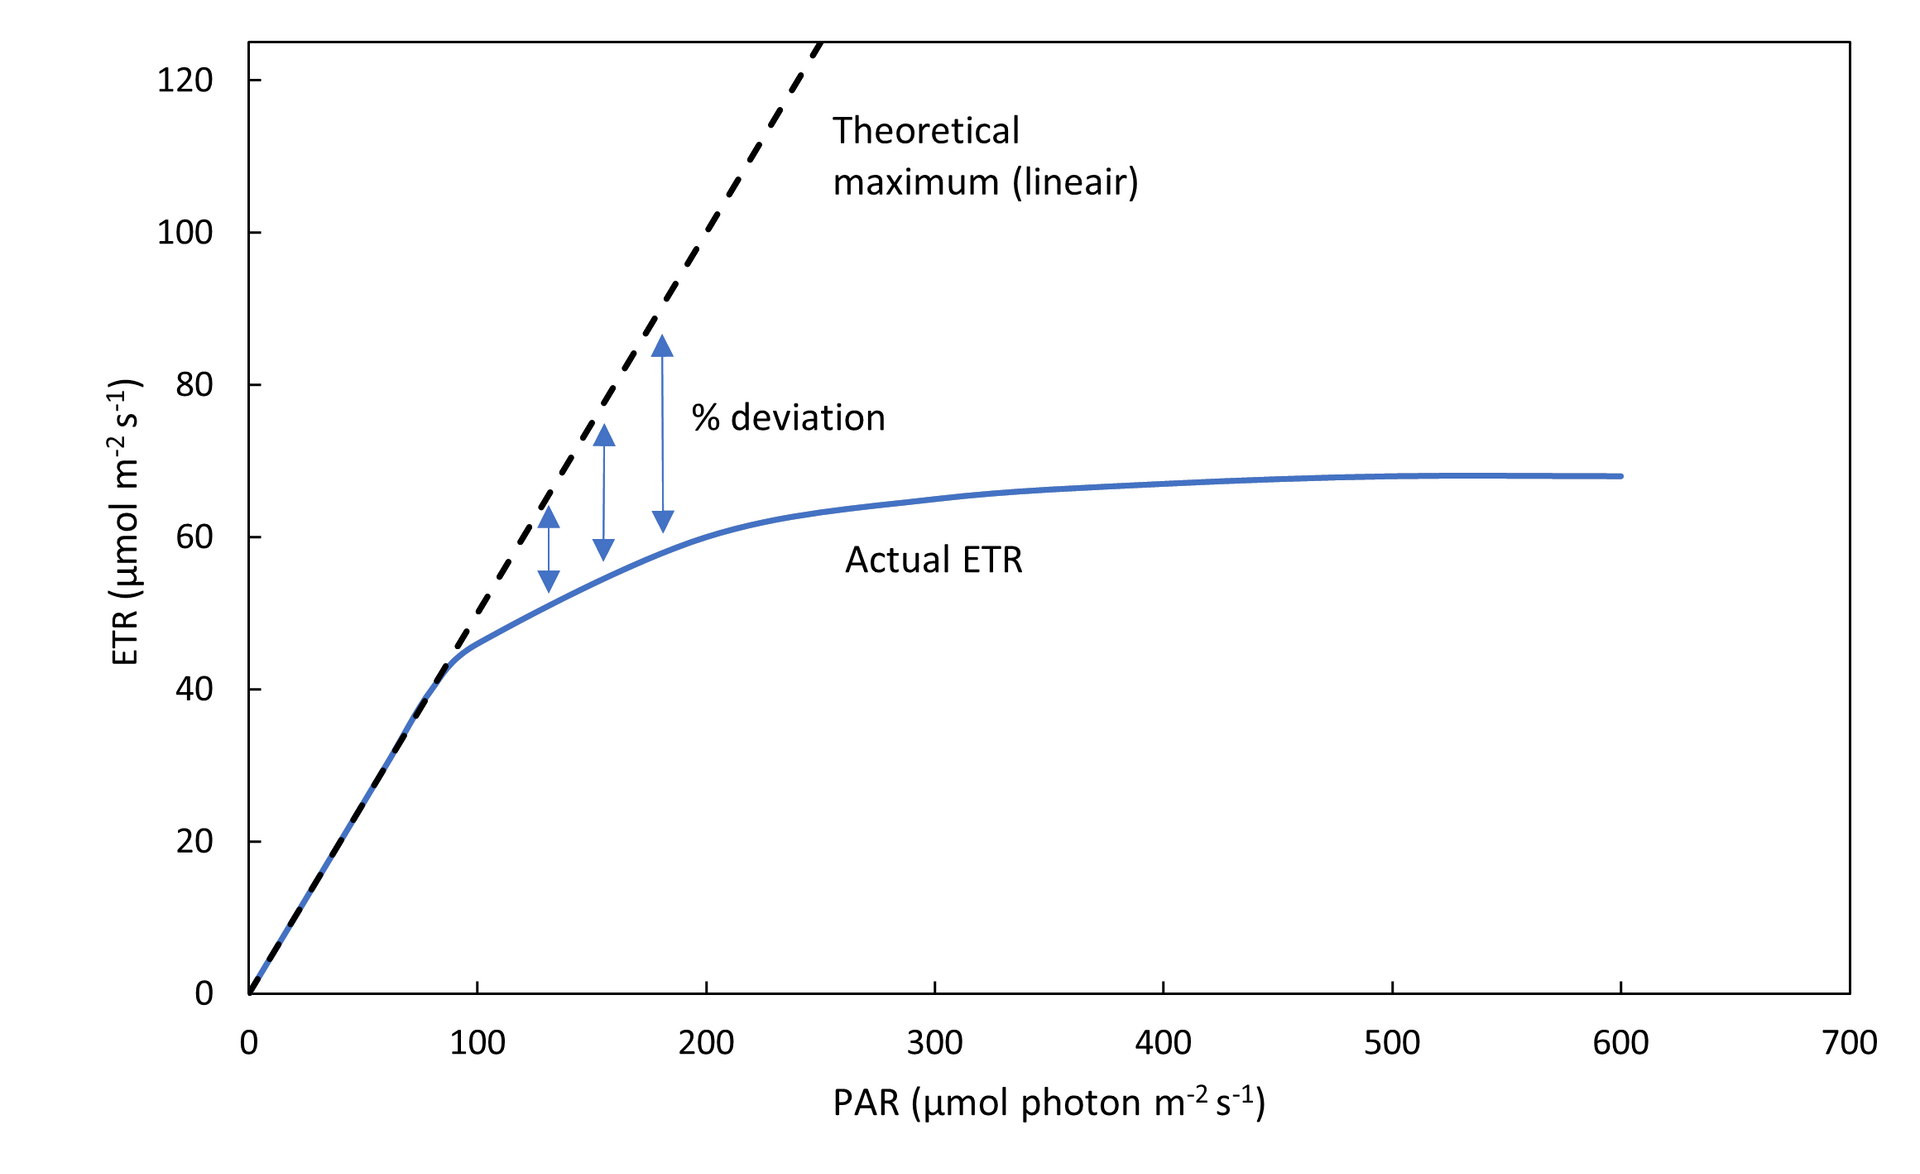
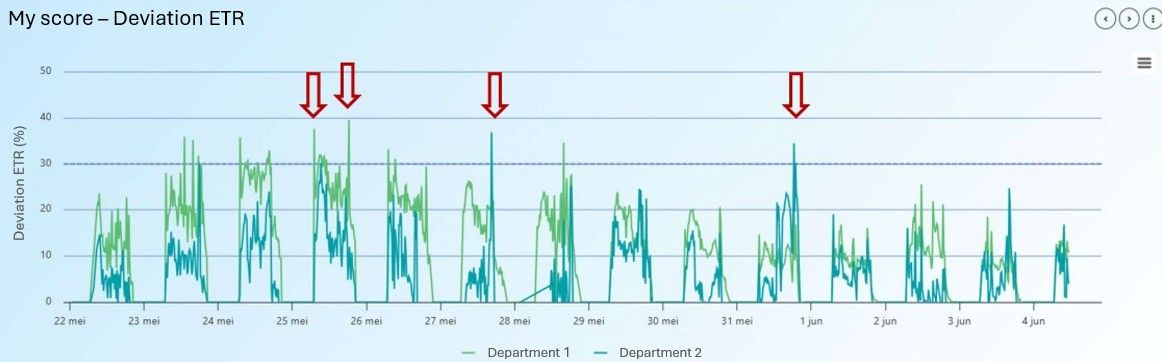
This grower also uses a parameter called deviation ETR (Figure 4). Deviation ETR is a measure of how far the current ETR (electron transport rate) deviates from the theoretical maximum. The system gives a warning when the deviation exceeds more than 30%.
On partly cloudy days, the value shot above the threshold (Figure 5 at the red arrows), whenever full sun hit the plants while the screens were still open.
All data in one place
The CF2GO sends its data to MyLedgnd, where you see it next to PAR, temperature, humidity, CO₂ and your other sensors. So you can steer screens and lighting on how the plant responds, not only on fixed settings like DLI or VPD. Data can also be downloaded or reached through an API, for example to link it to the climate computer.

For more information about the CF2GO, visit: https://www.phenovation.com/cf2go or https://www.cf2go.nl/