
PlantAlize - Image Analysis Software
PlantAlize is PhenoVation’s image analysis software designed to make plant phenotyping simple and efficient. With a clear user interface, it allows users to process and analyze images without the need for coding or complex workflows.
The software supports RGB images, photosynthesis data, multispectral images, and GFP/RFP data from PhenoVation systems, while also allowing users to import their own RGB images. Built-in segmentation models automatically separate plants from the background, ensuring consistent and reliable results.
PlantAlize - NO YEARLY FEE!
We offer 3 types of PlantAlize:
- Free RGB edition
- Standard License
- Enterprise License
For the full comparison between the licensed see table below.
Data Presentation
Image Export
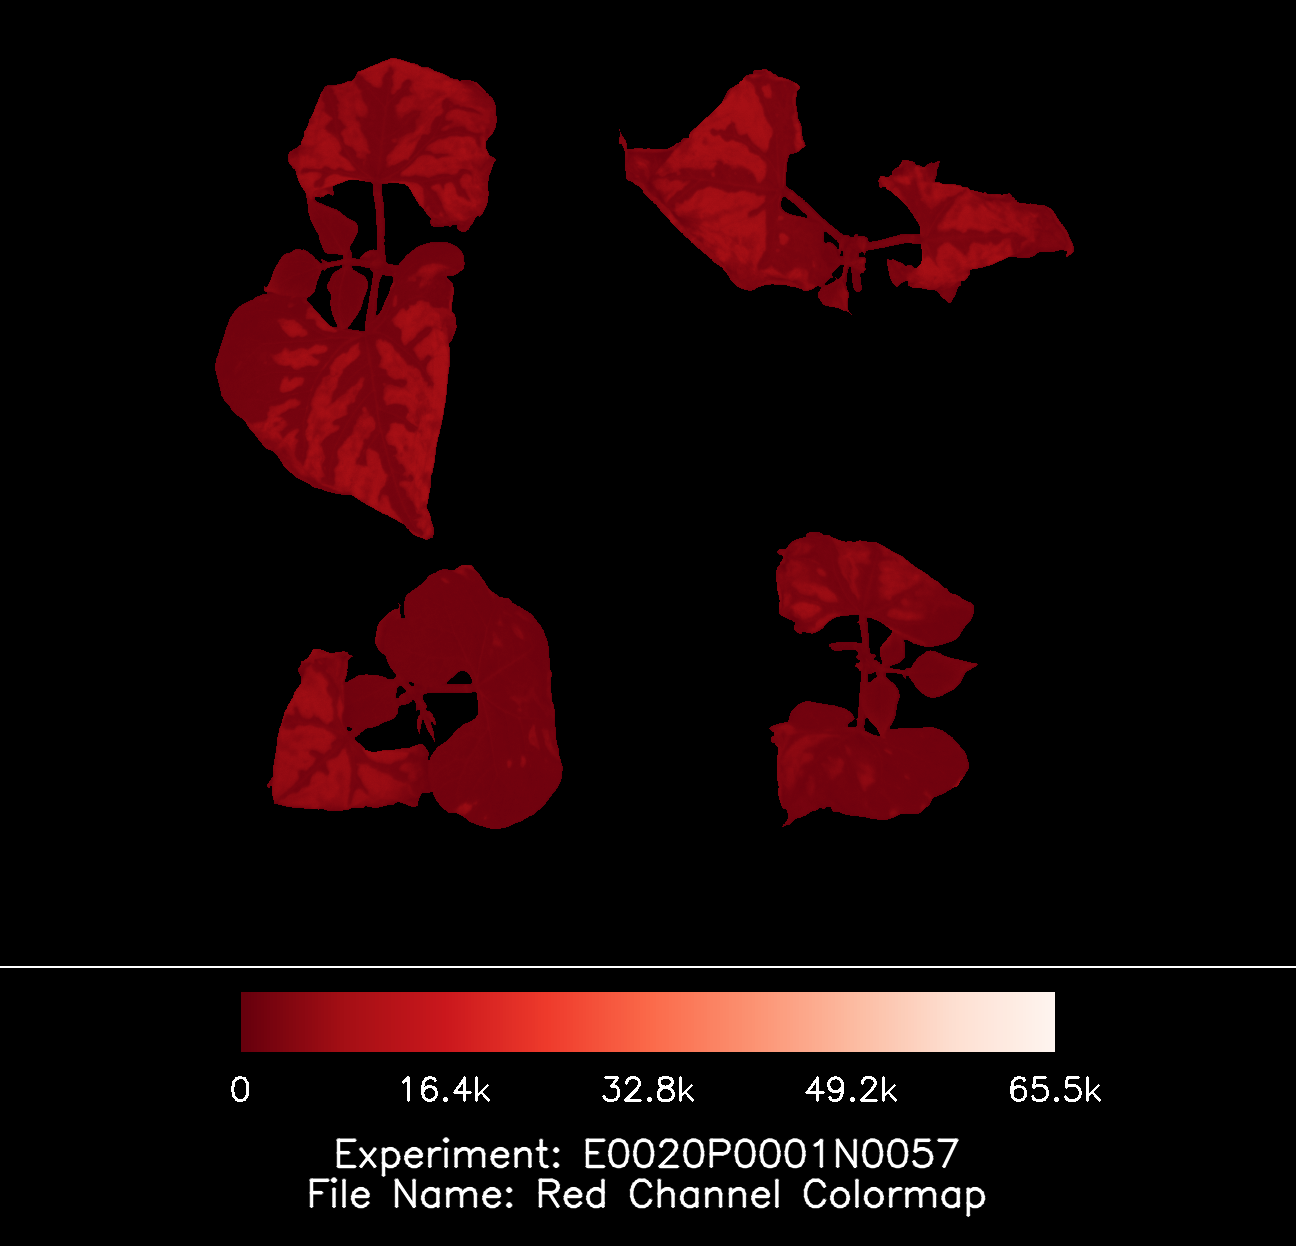
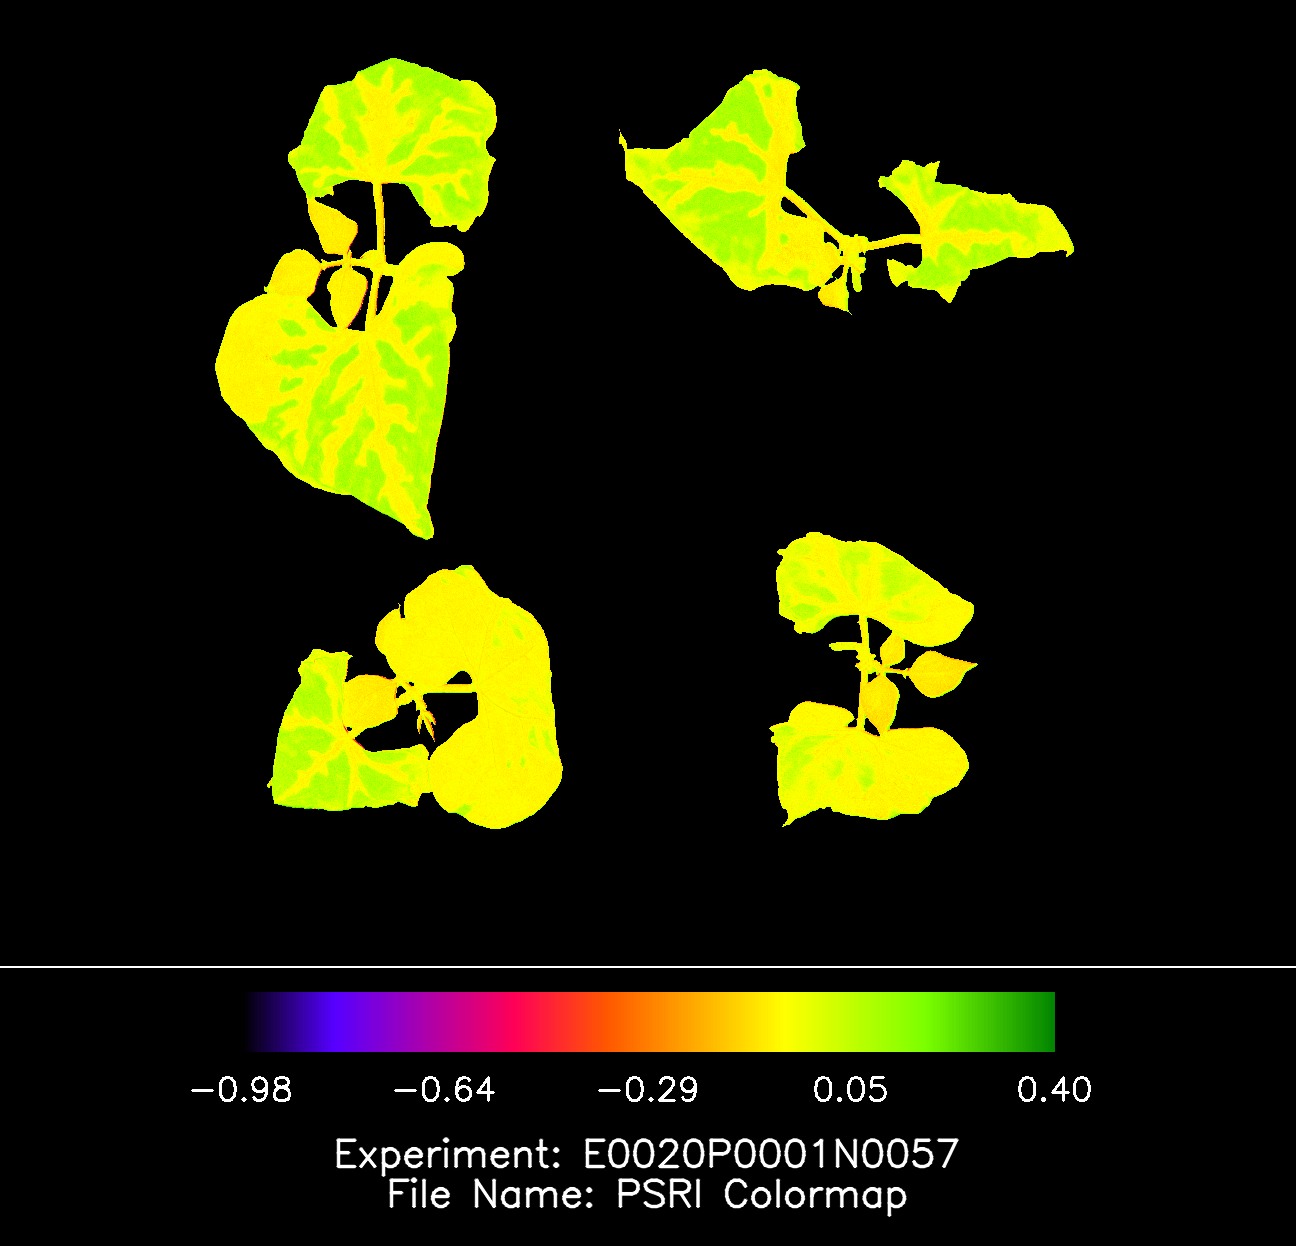
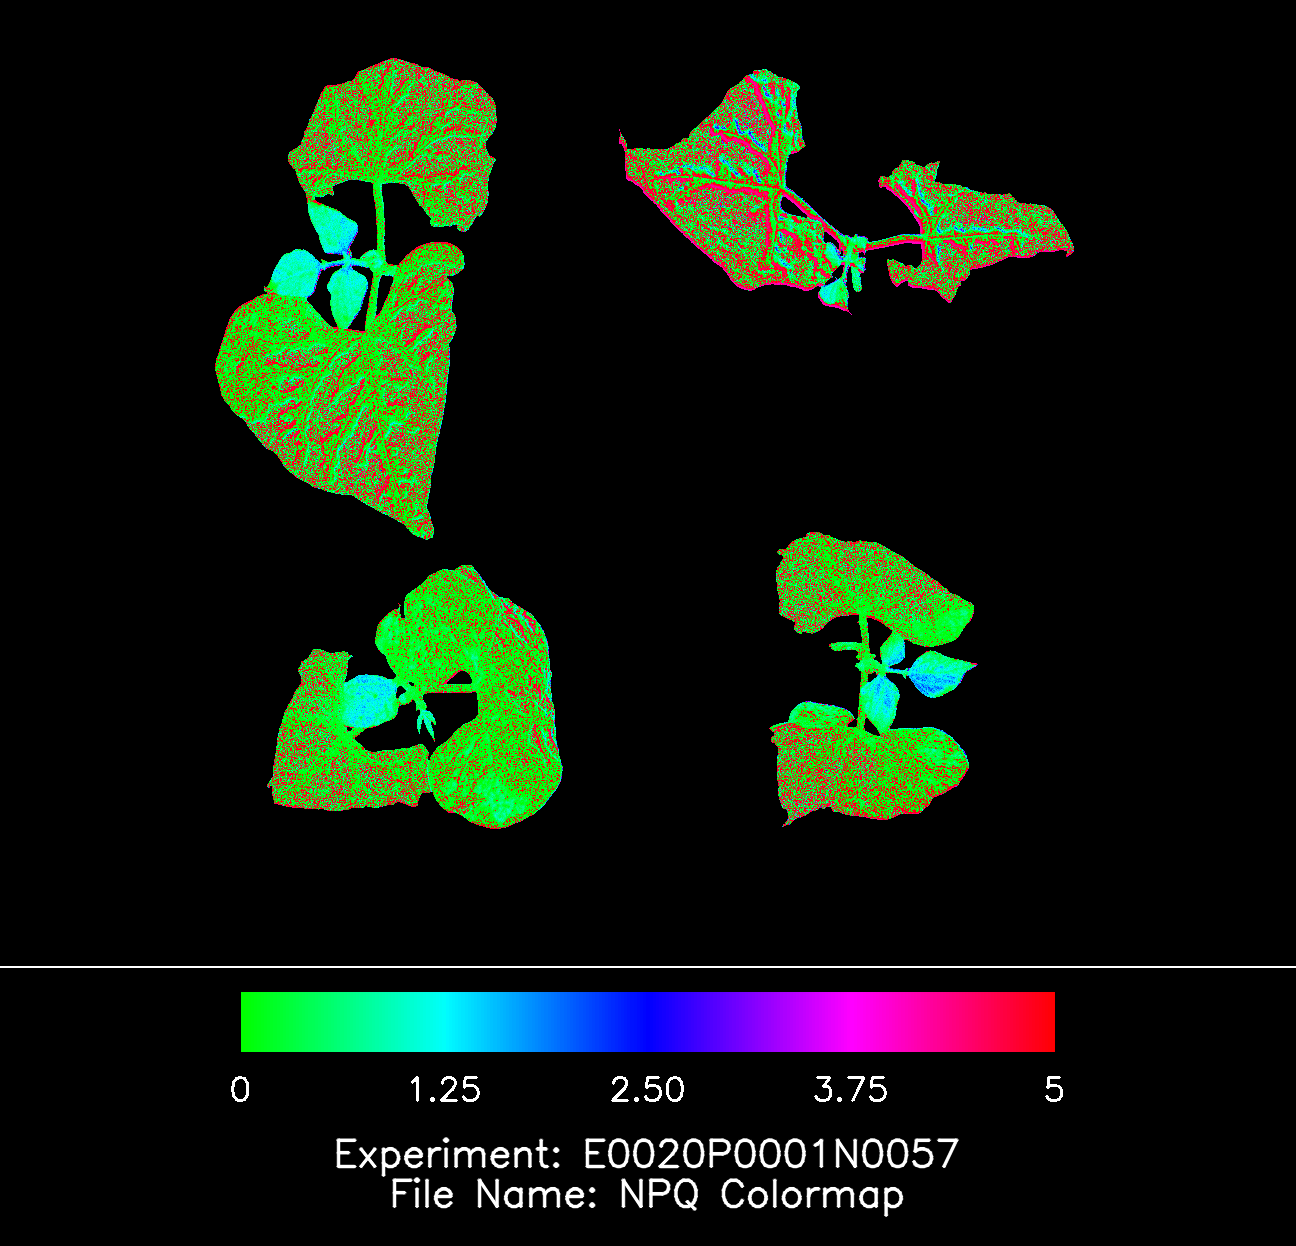
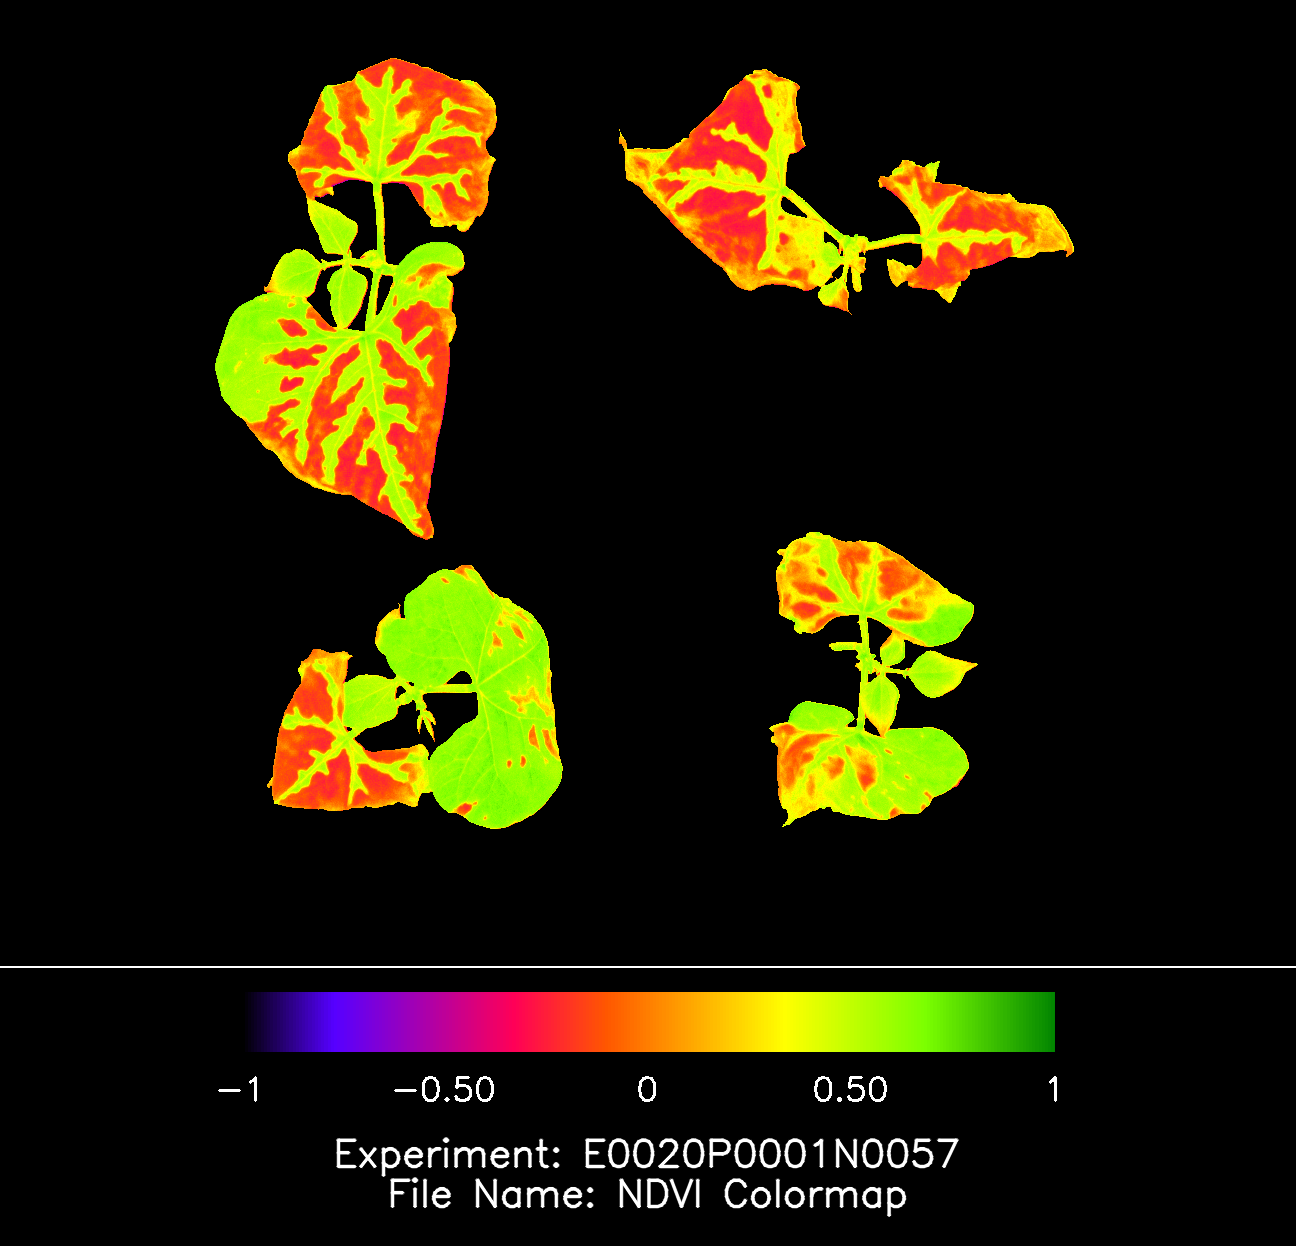
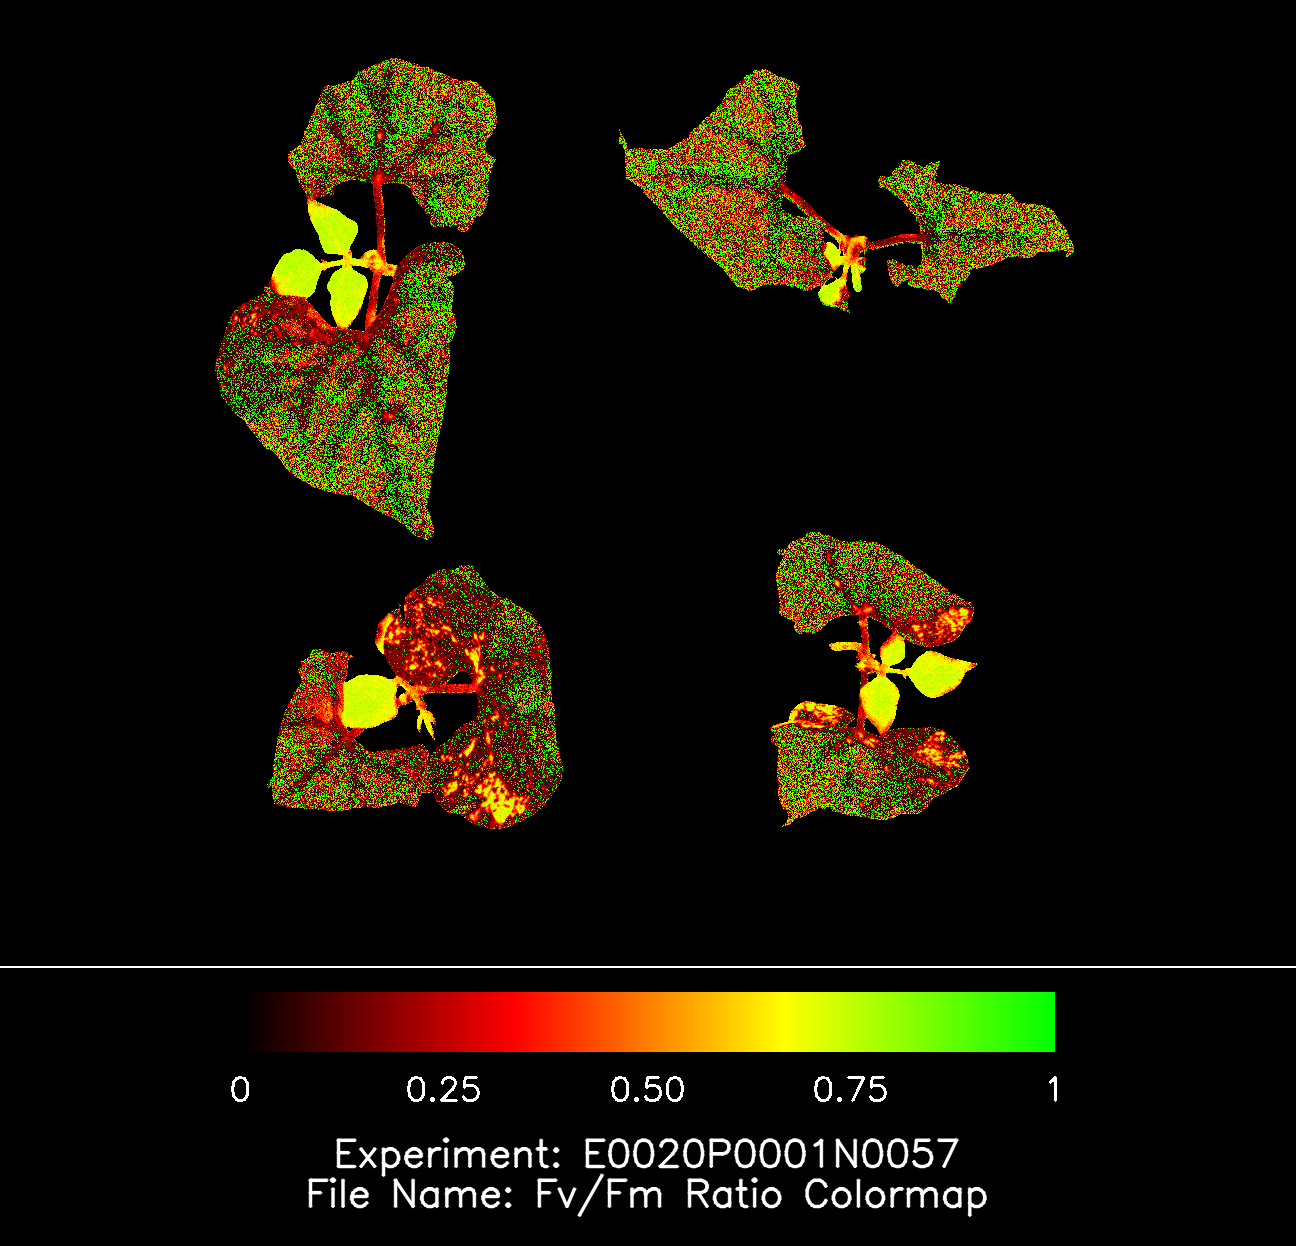
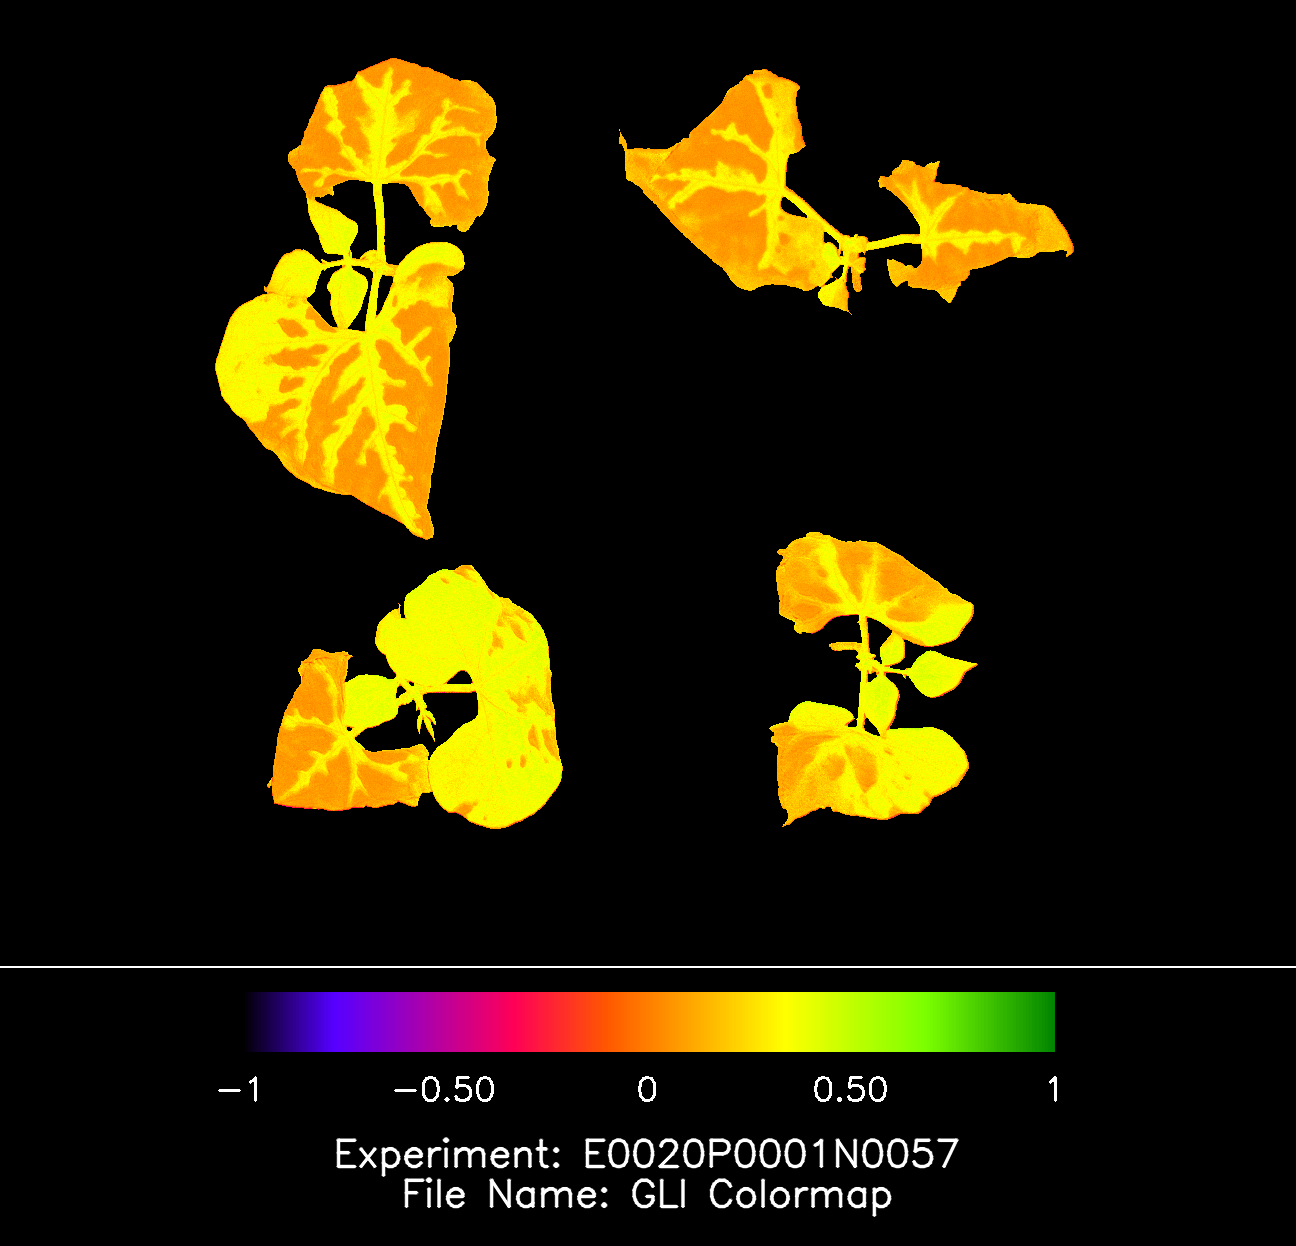
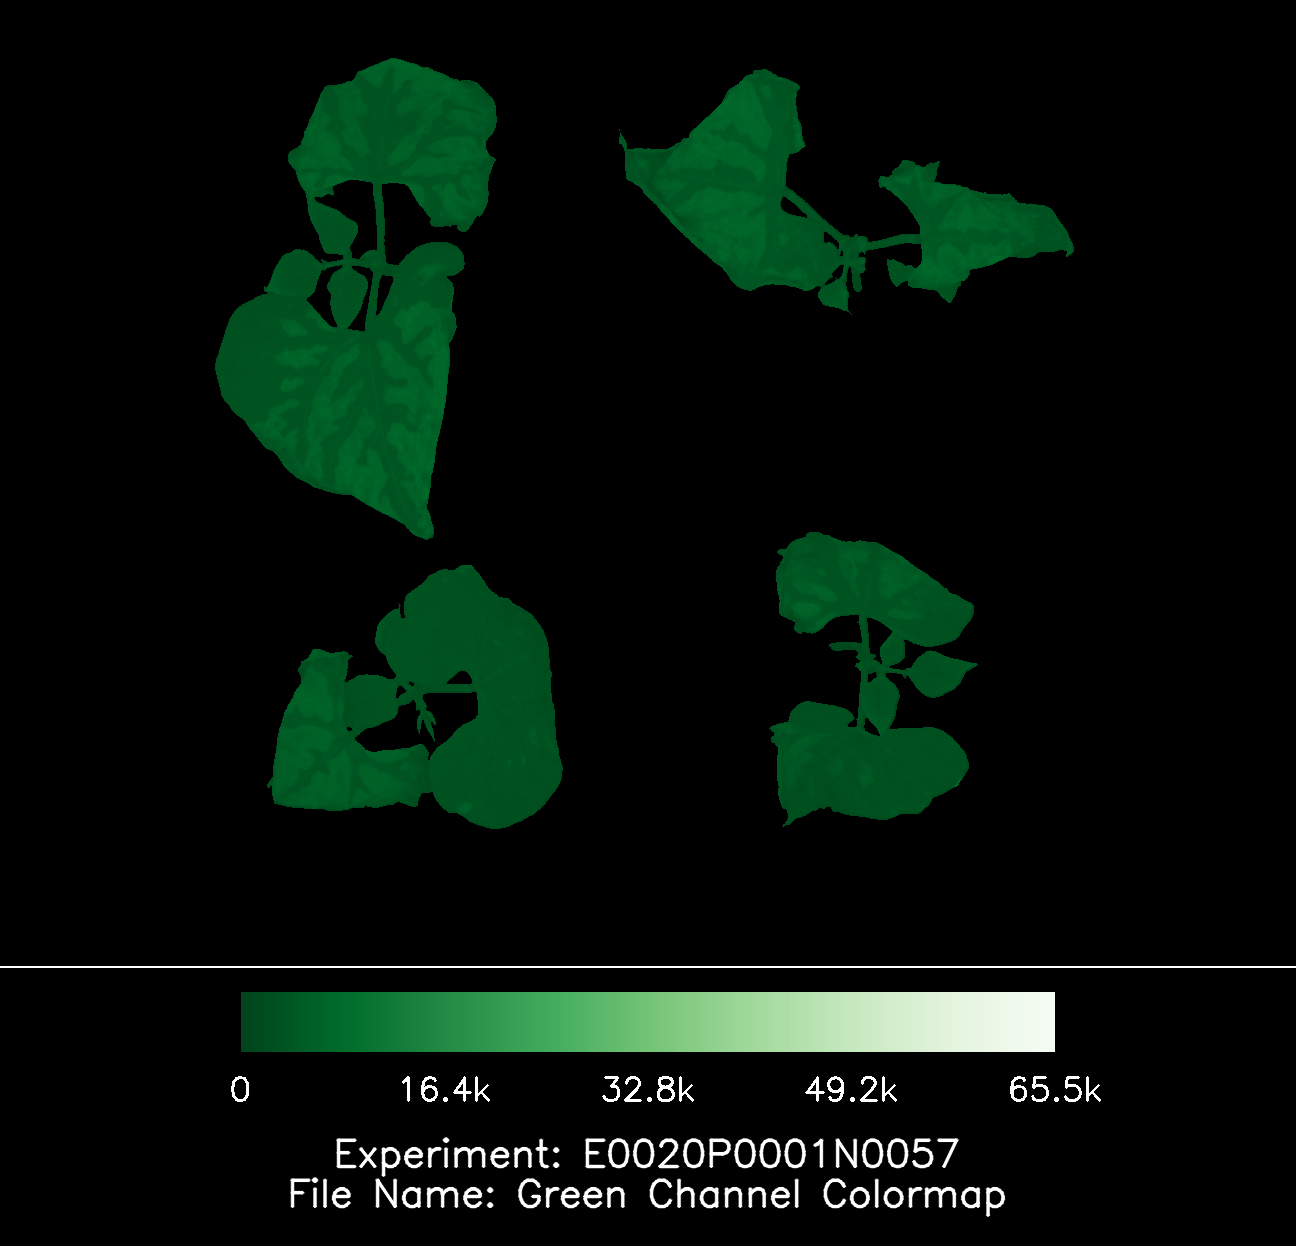
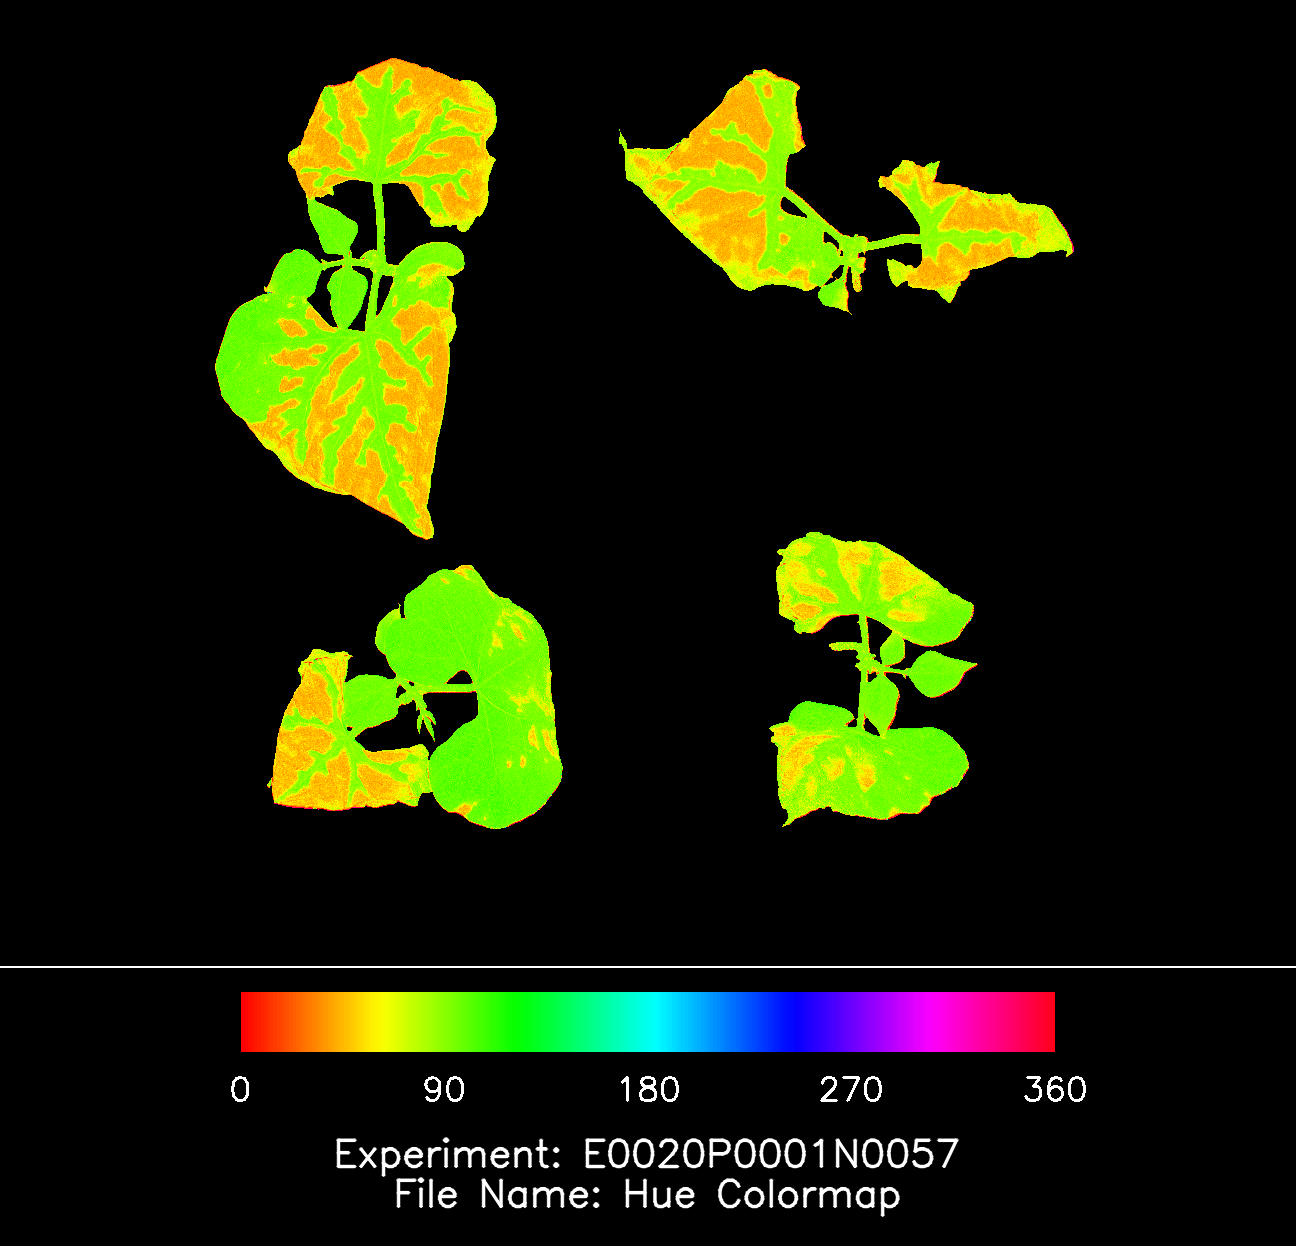
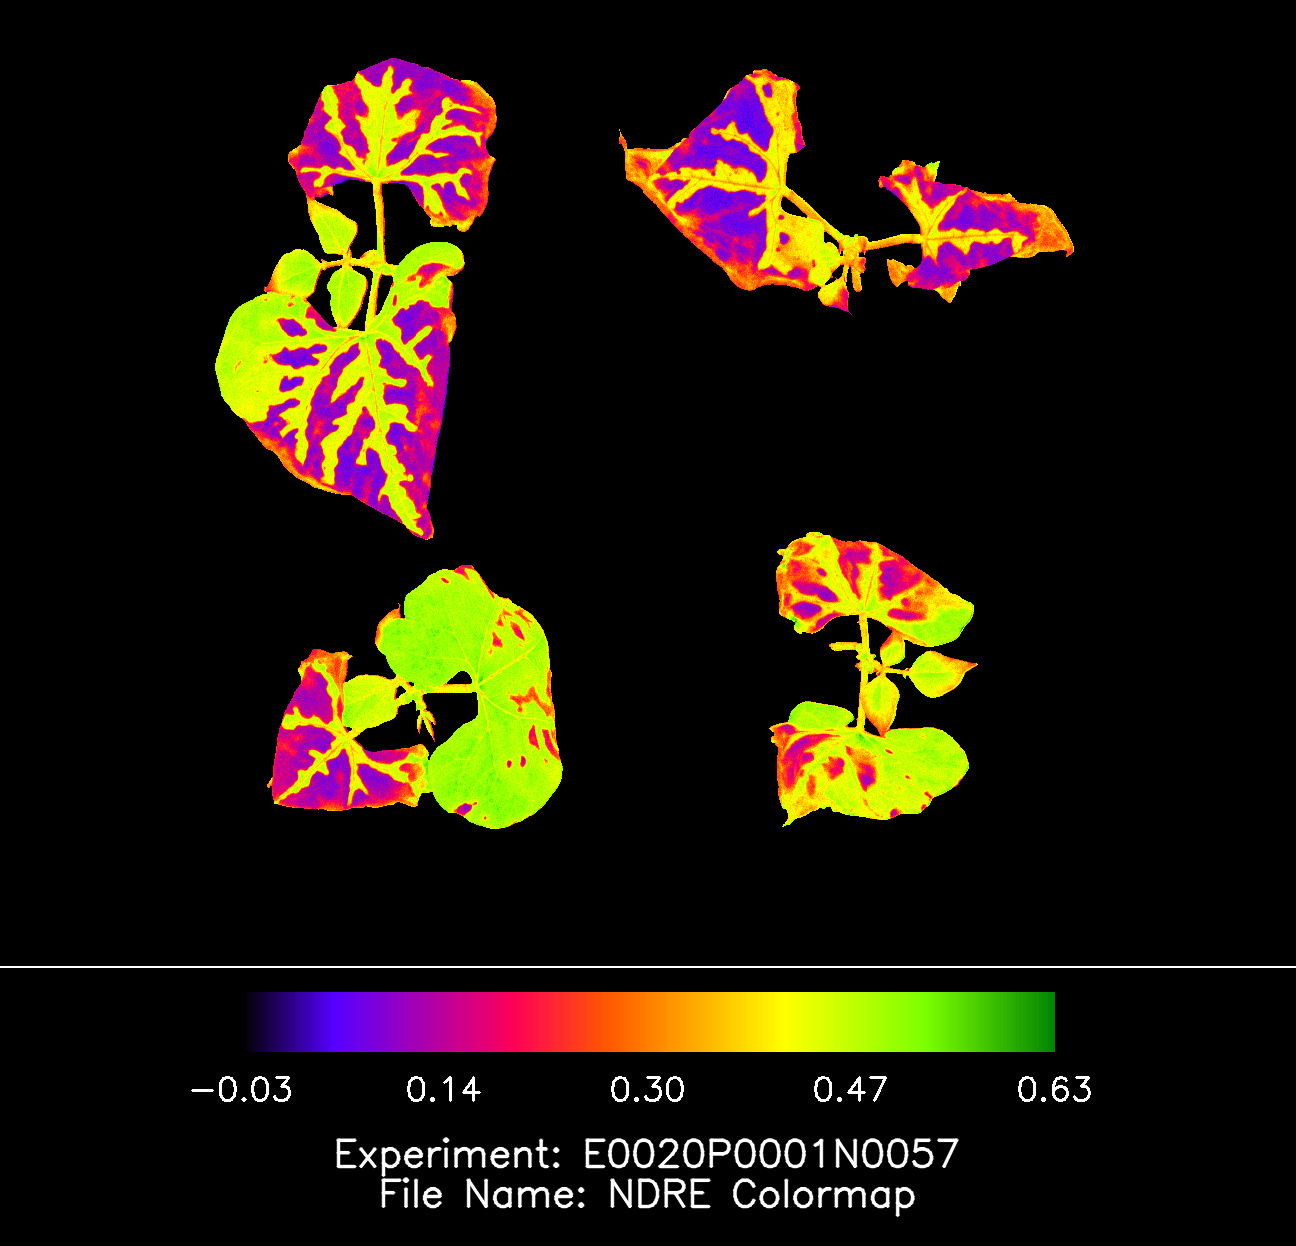
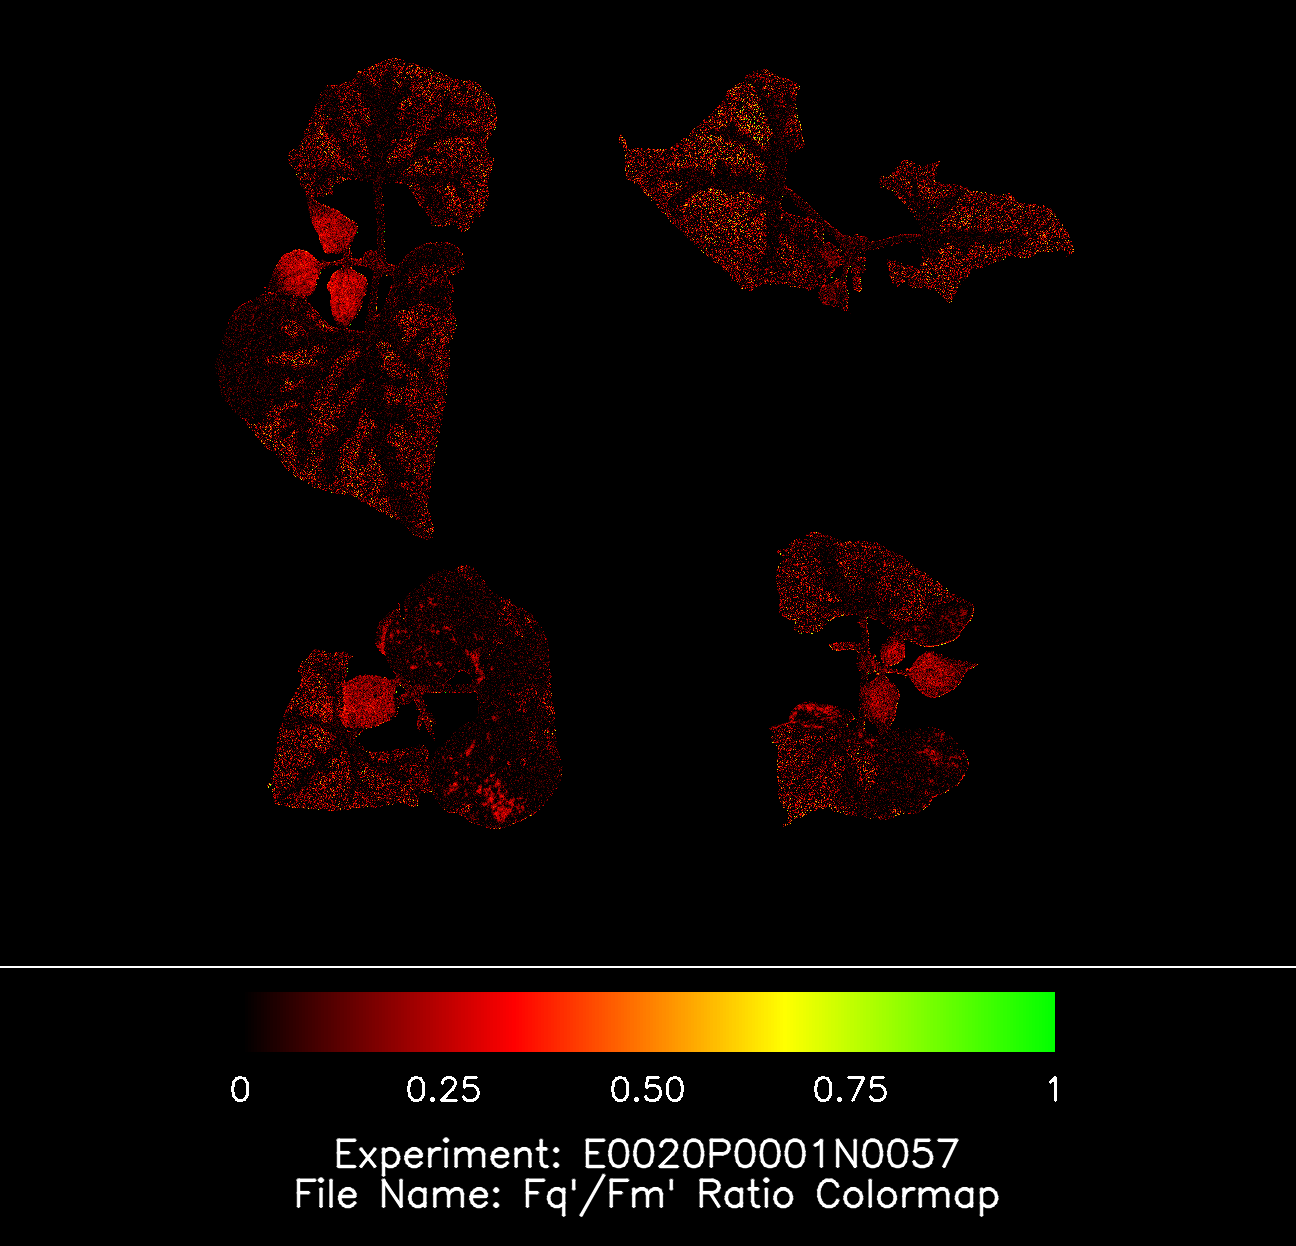
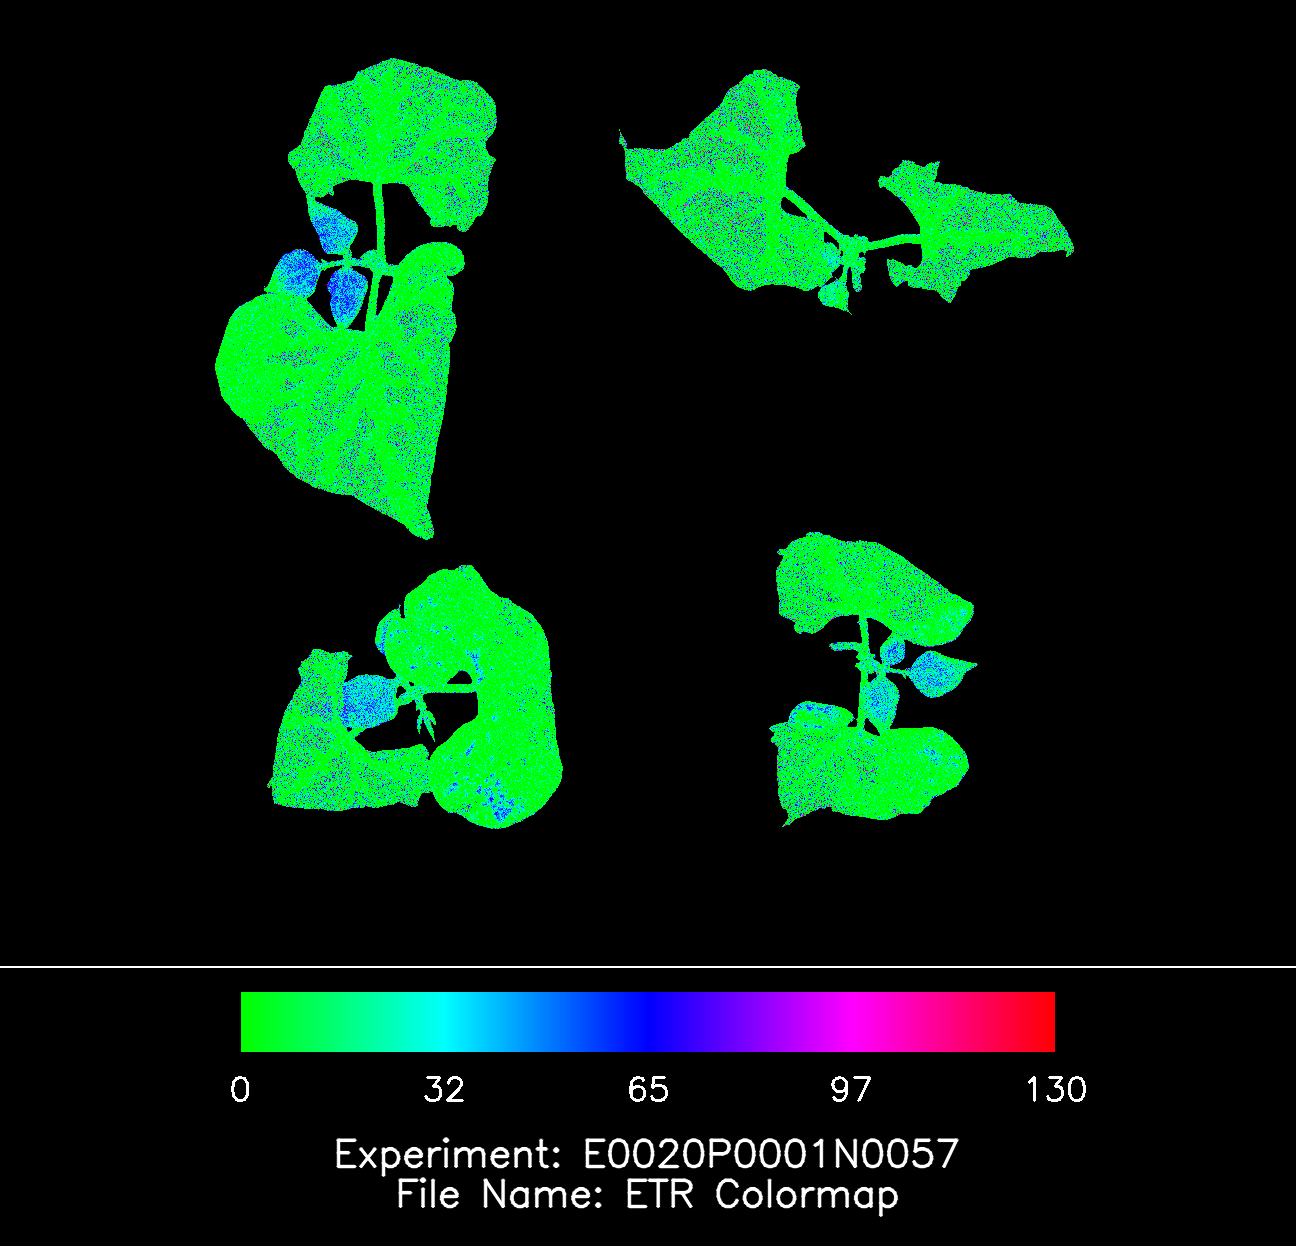
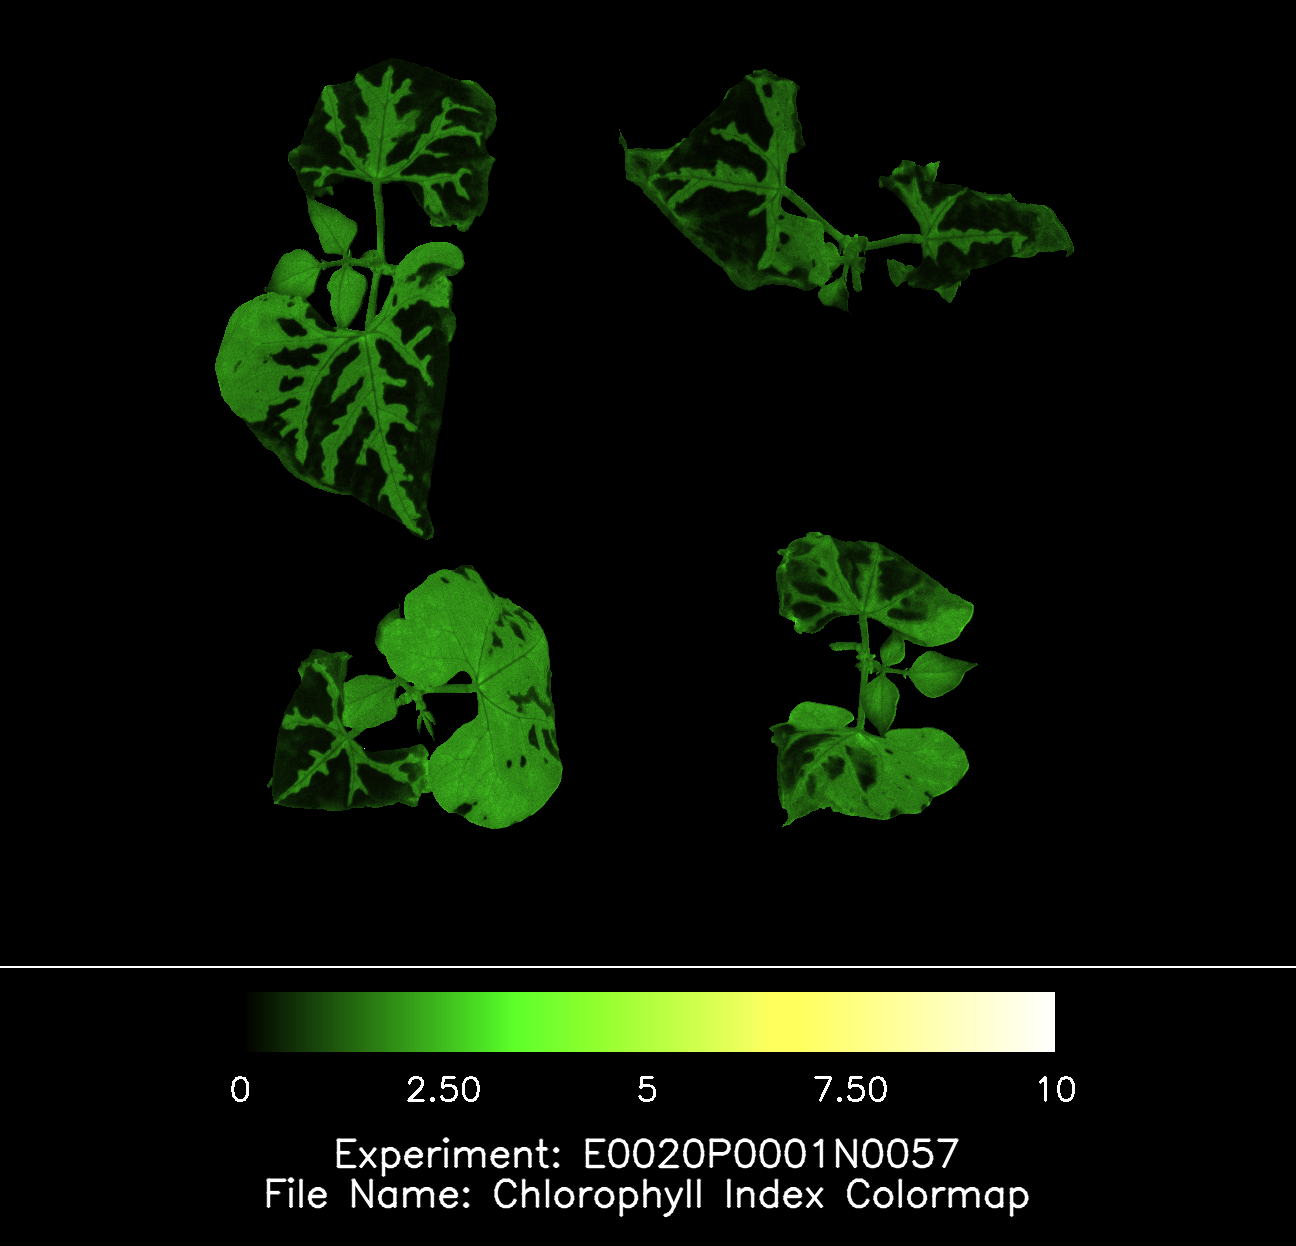
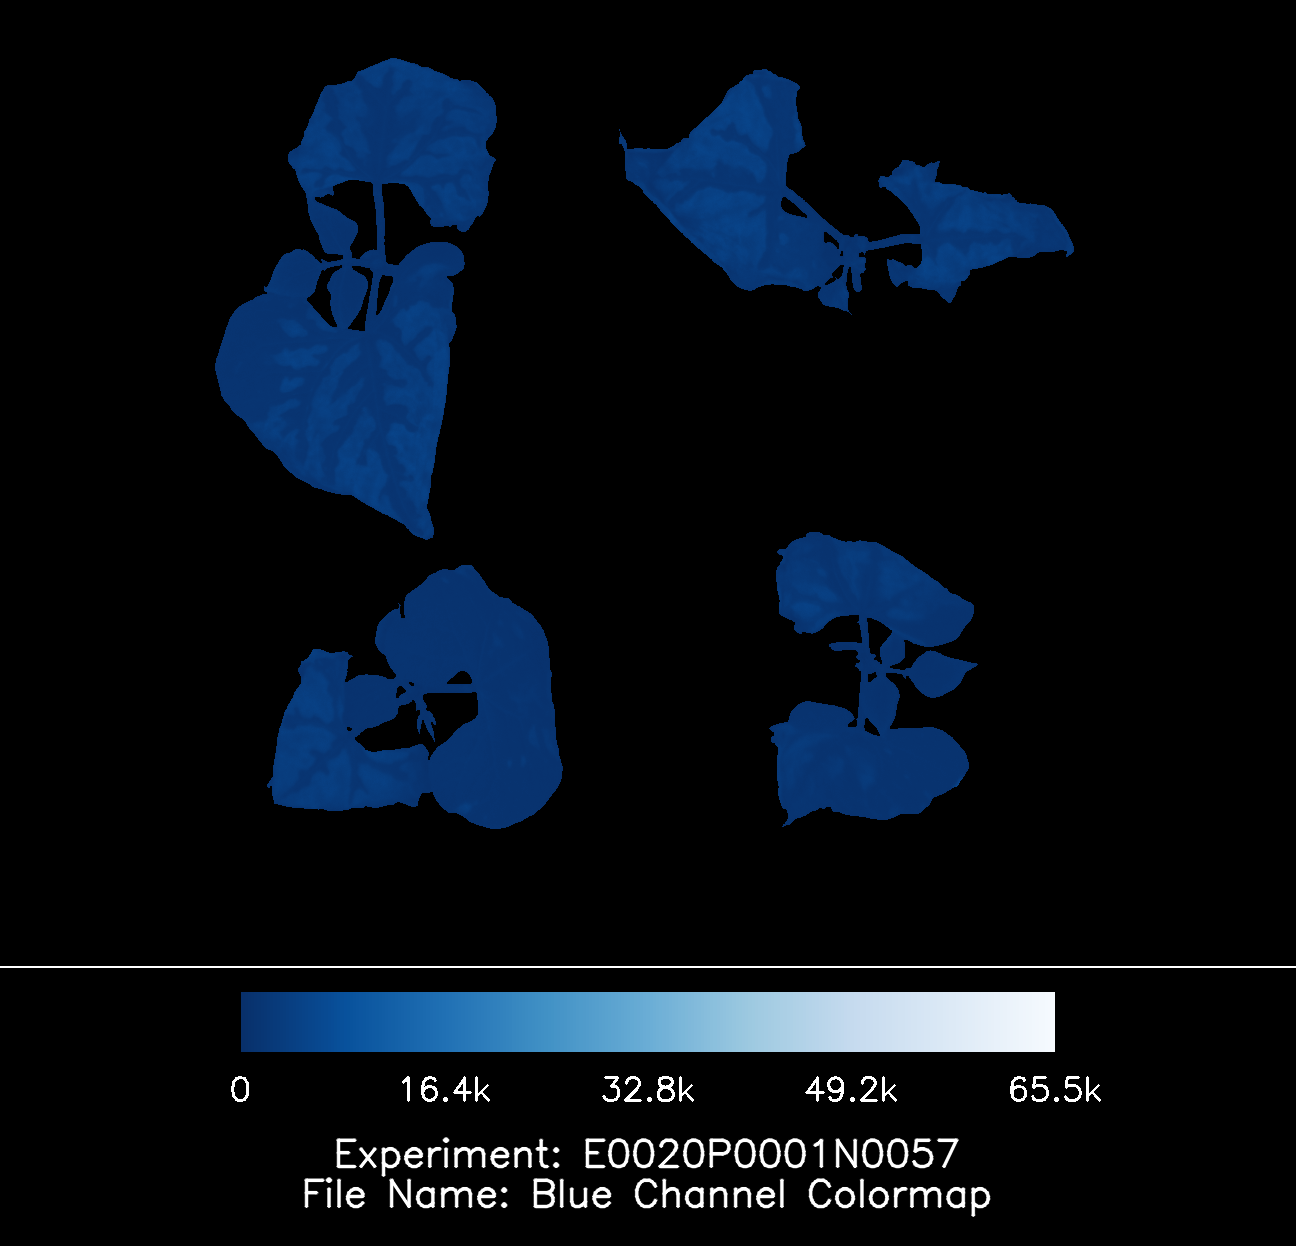
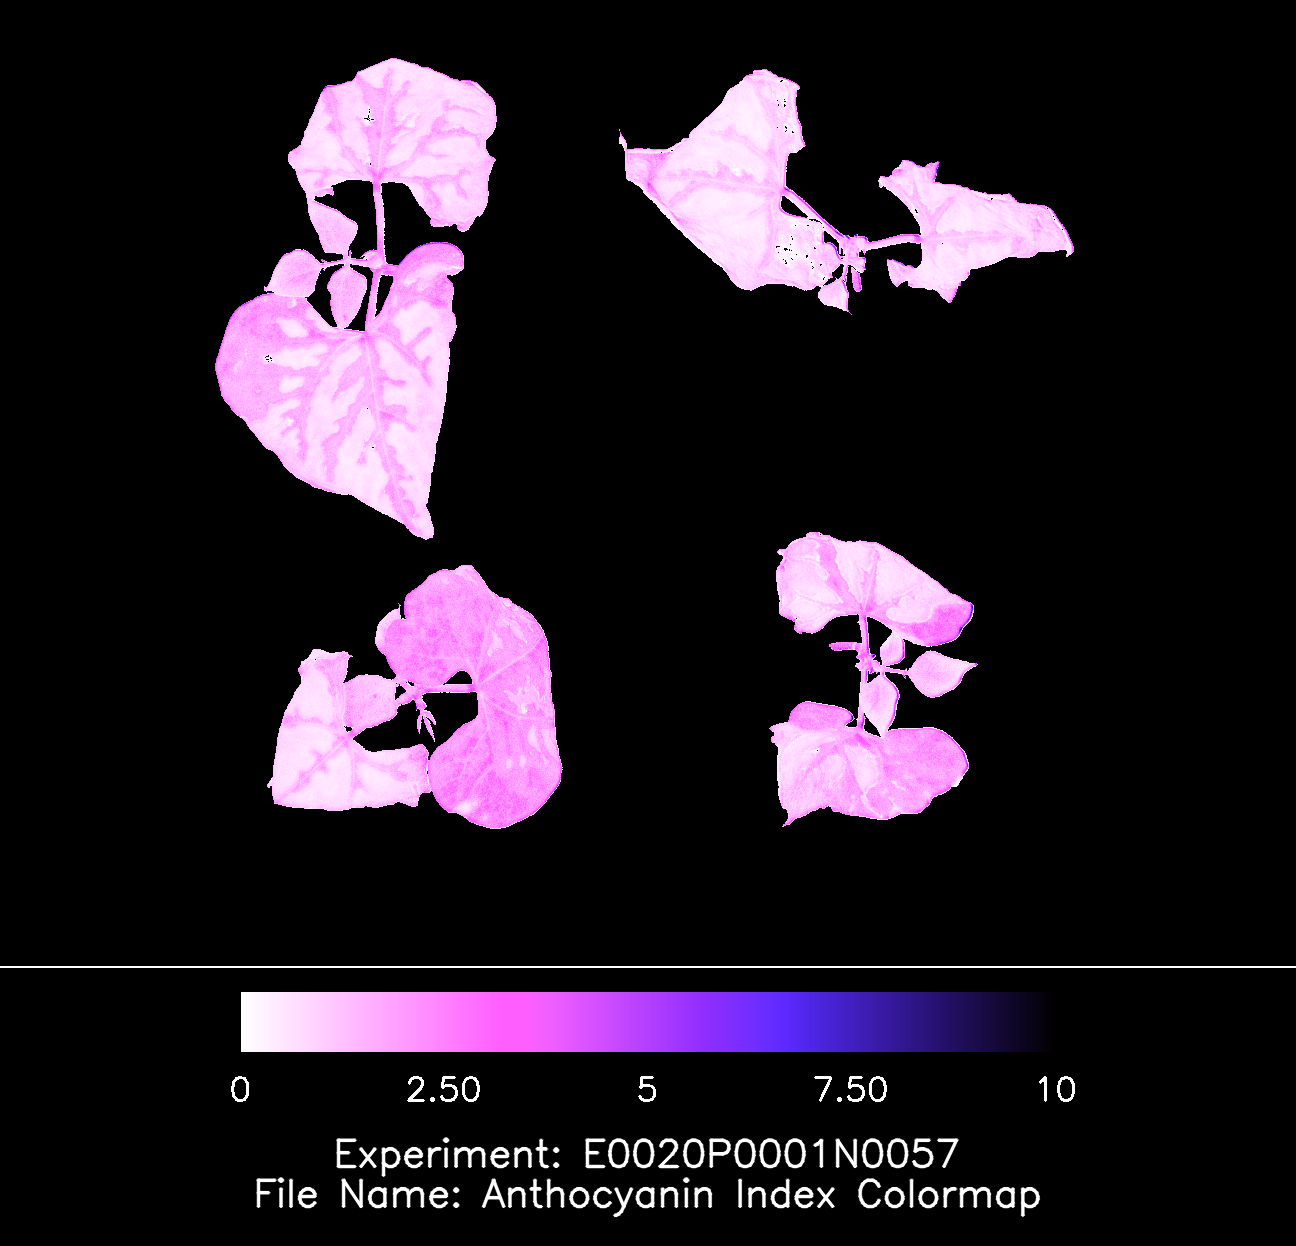
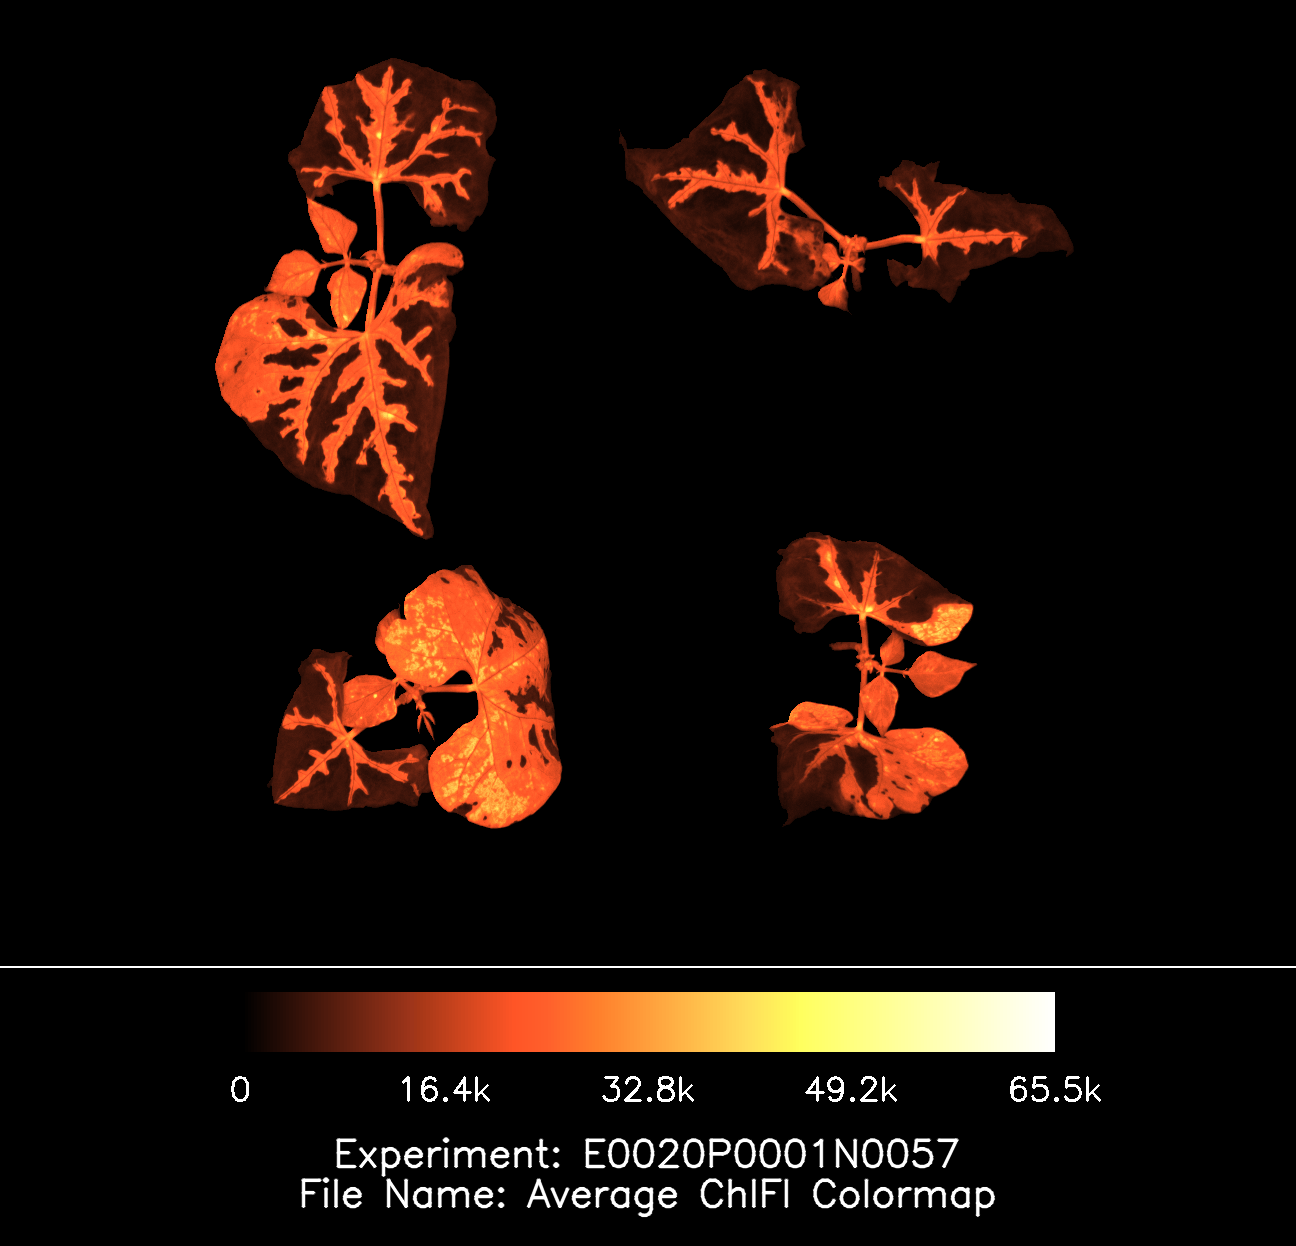
All images generated by our systems are exported using a false color table. This approach translates subtle variations in plant performance into clear visual differences, making it easy to identify abnormalities at a glance. Stress responses, inefficiencies in photosynthesis, or early signs of plant health issues become immediately visible without the need for complex data interpretation.
Each exported image is fully documented to ensure traceability and clarity. At the bottom of every image, the experiment number and trial name are automatically included, providing direct reference to the measurement. In addition, the legend of the false color table is embedded within the image, allowing users to instantly understand the meaning of each color scale without referring to external documentation.
This combination of visual clarity and built-in metadata ensures that every image is not only easy to interpret but also ready to use for reporting, analysis, and sharing across teams.
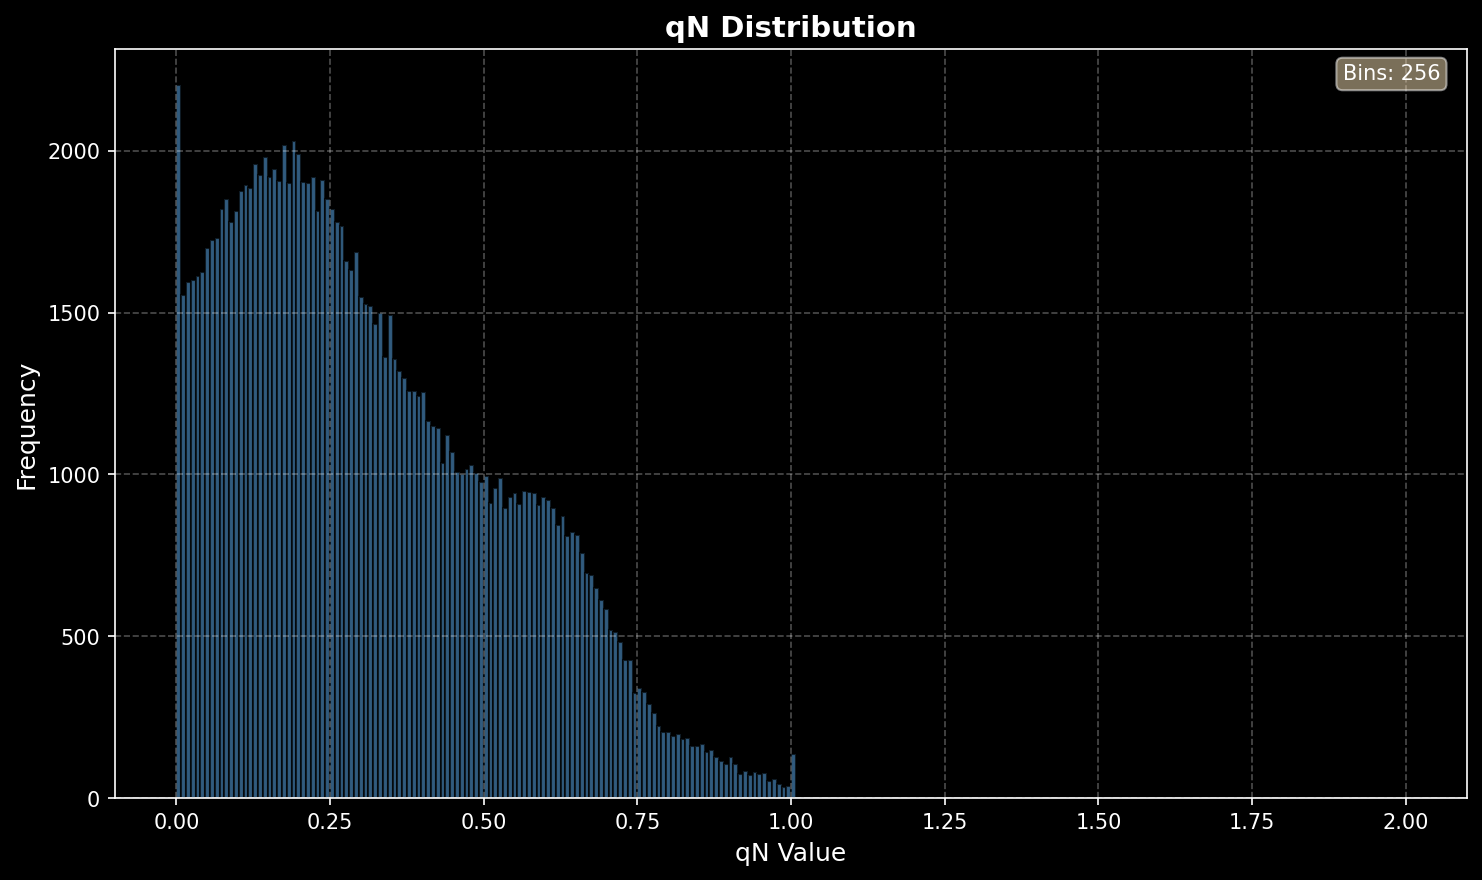
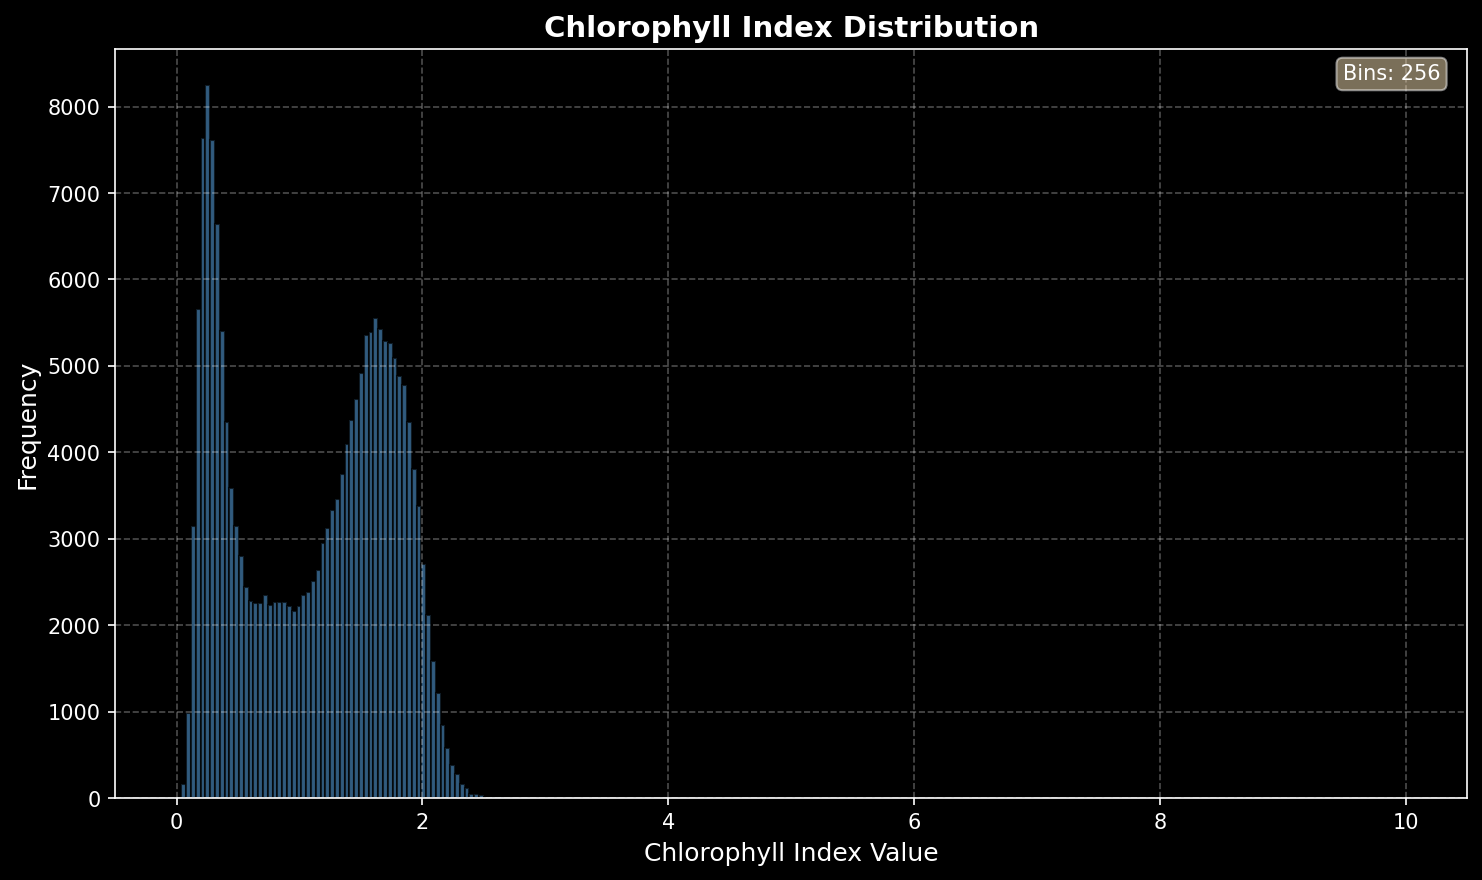
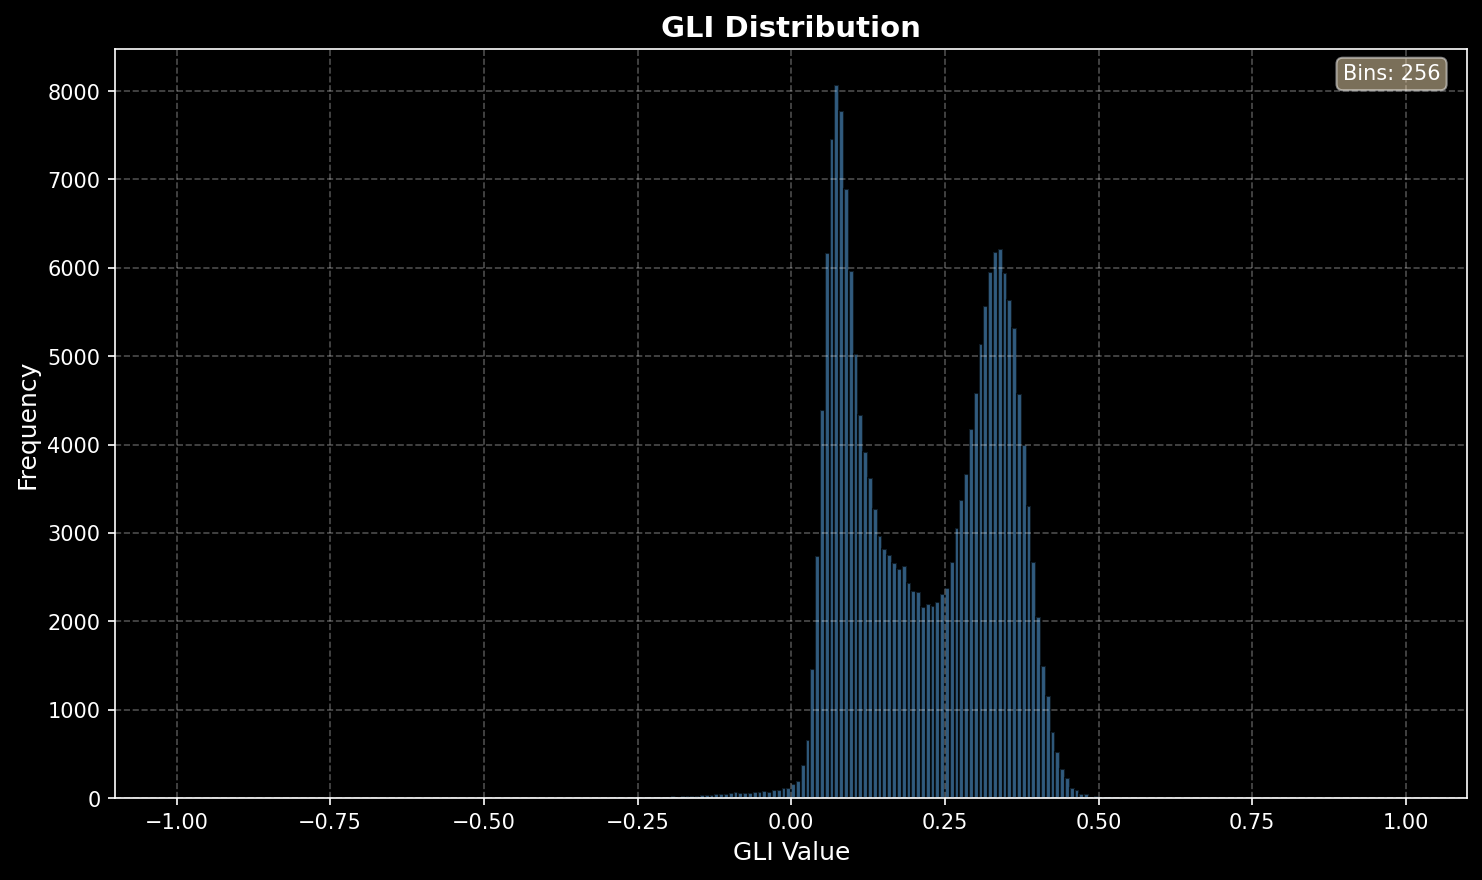
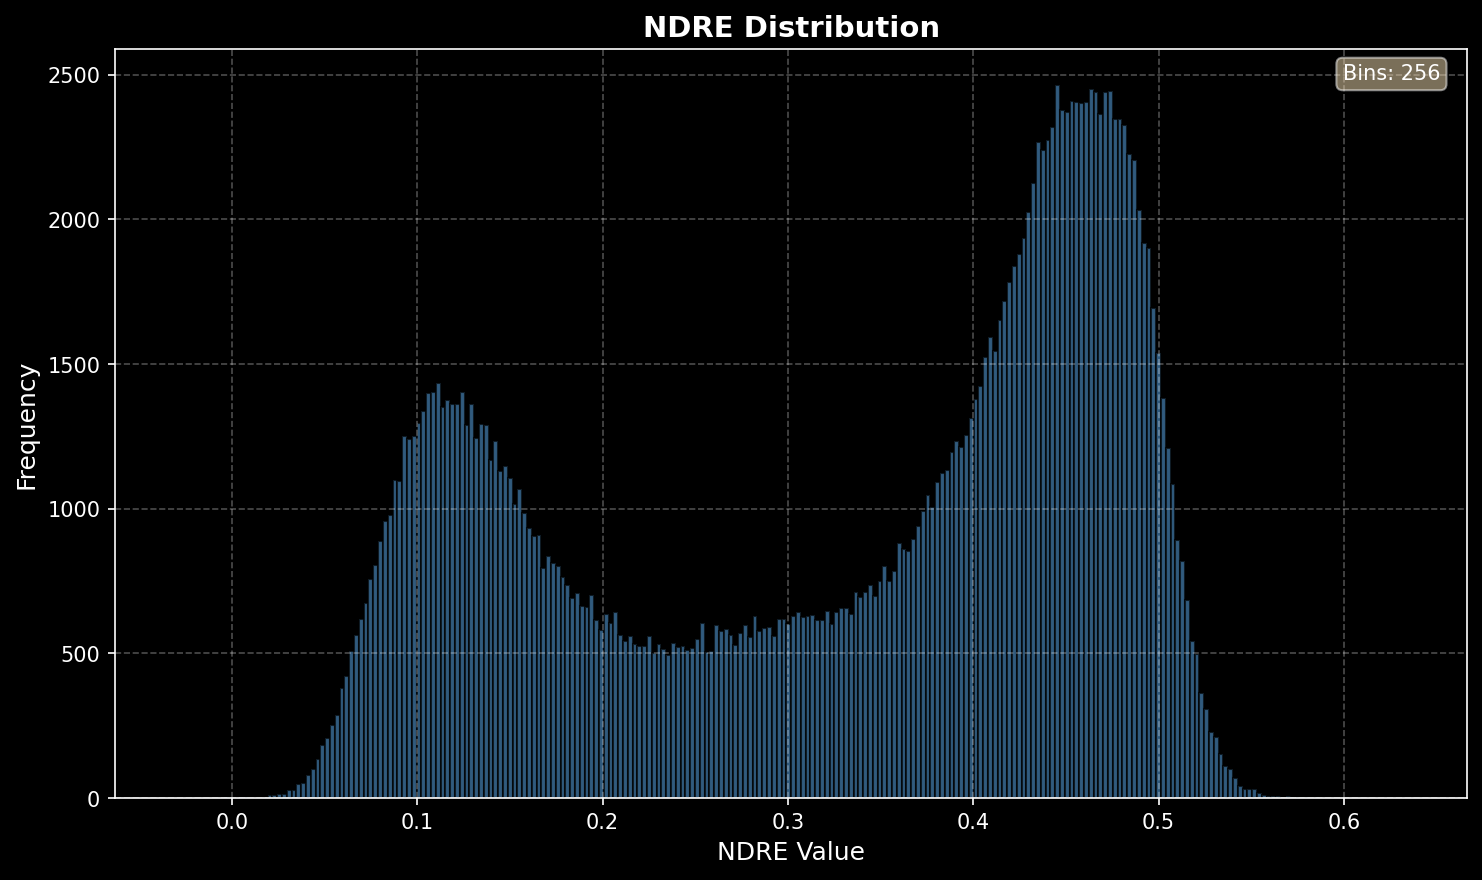
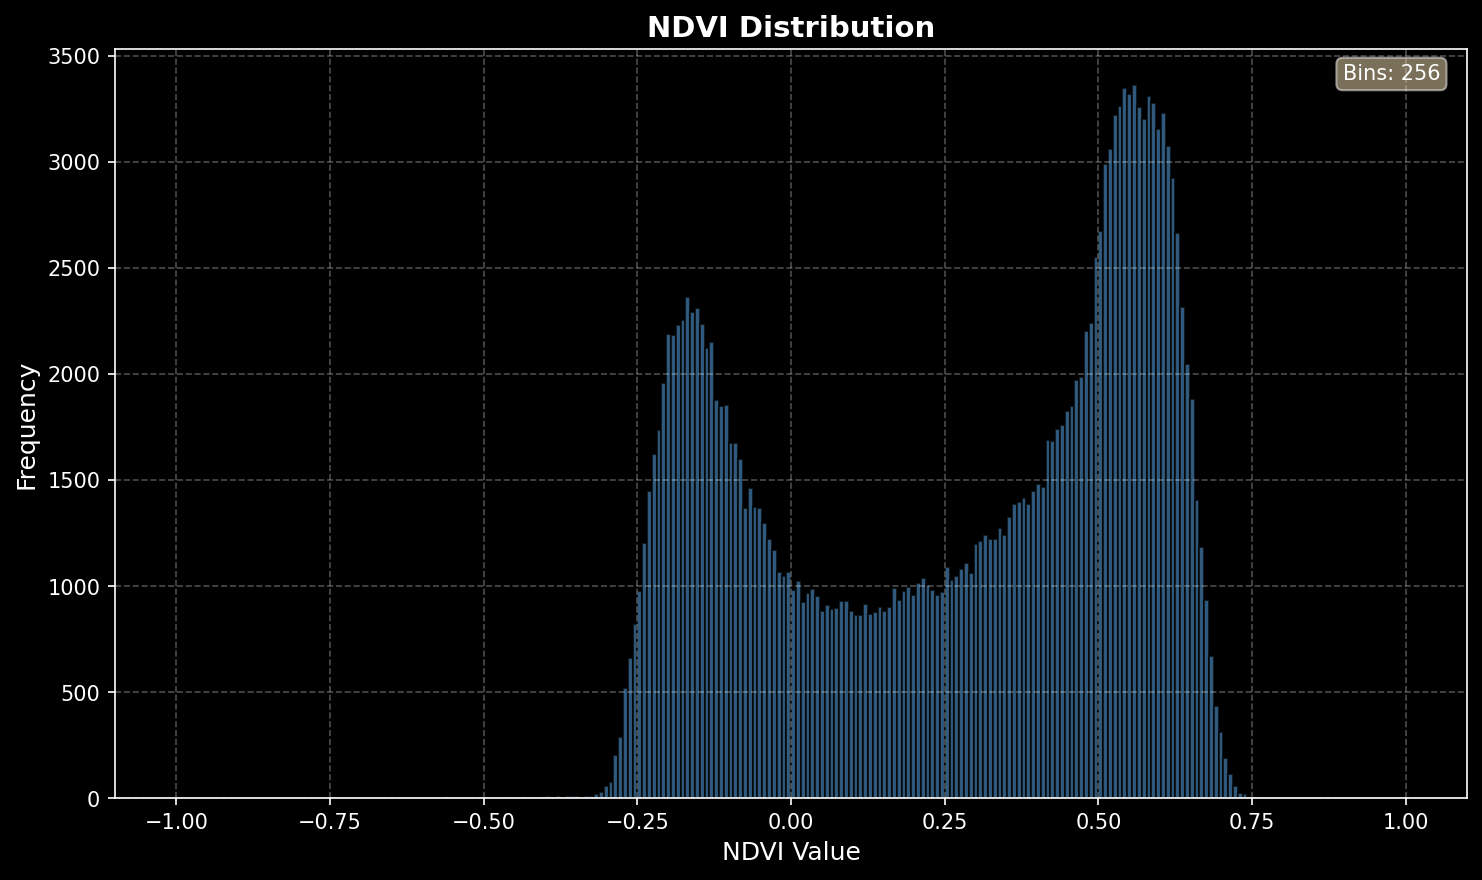
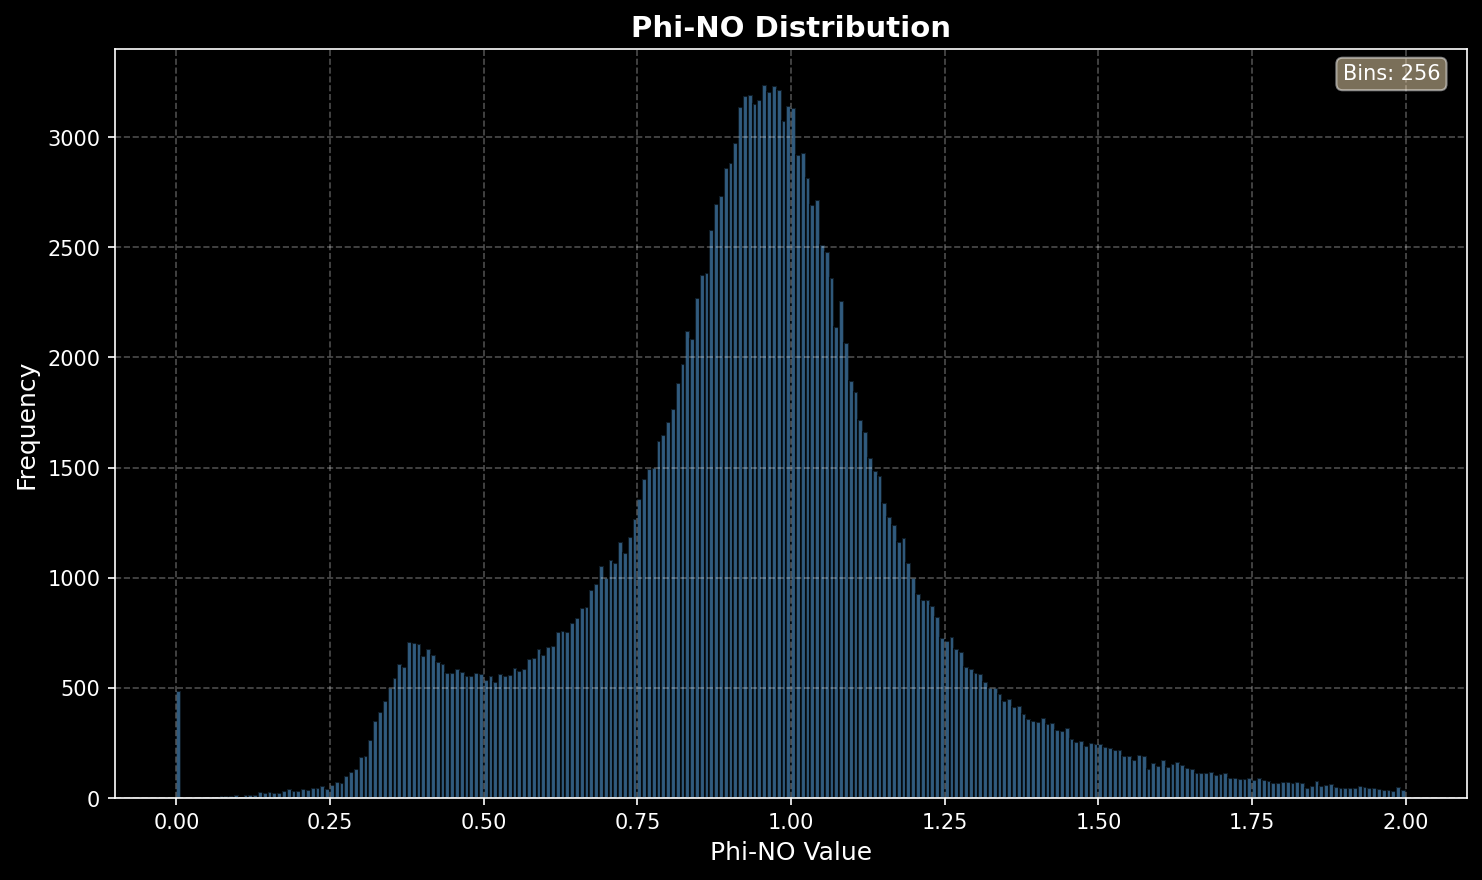
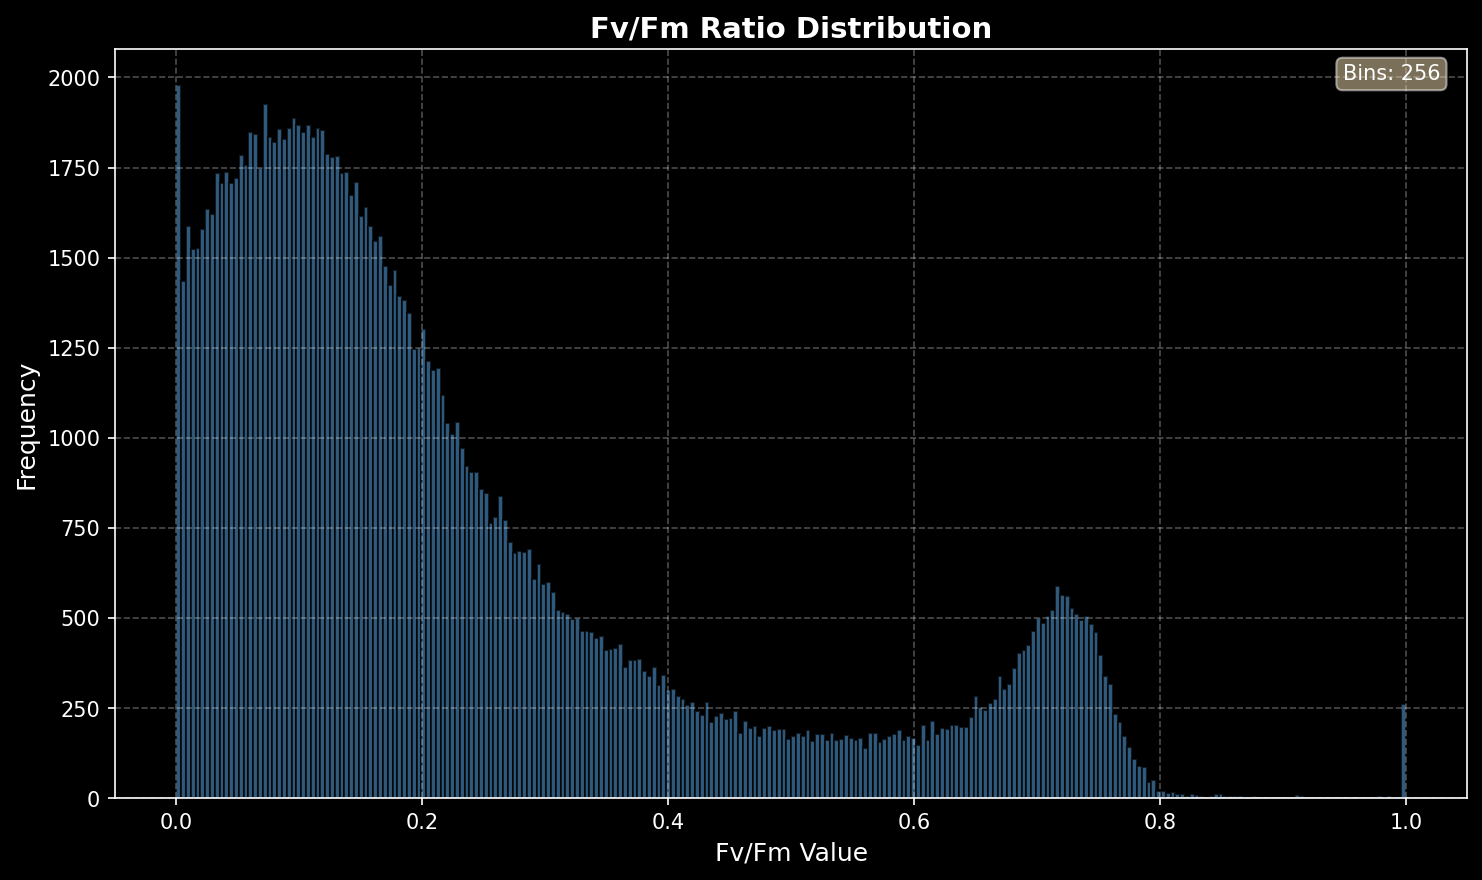
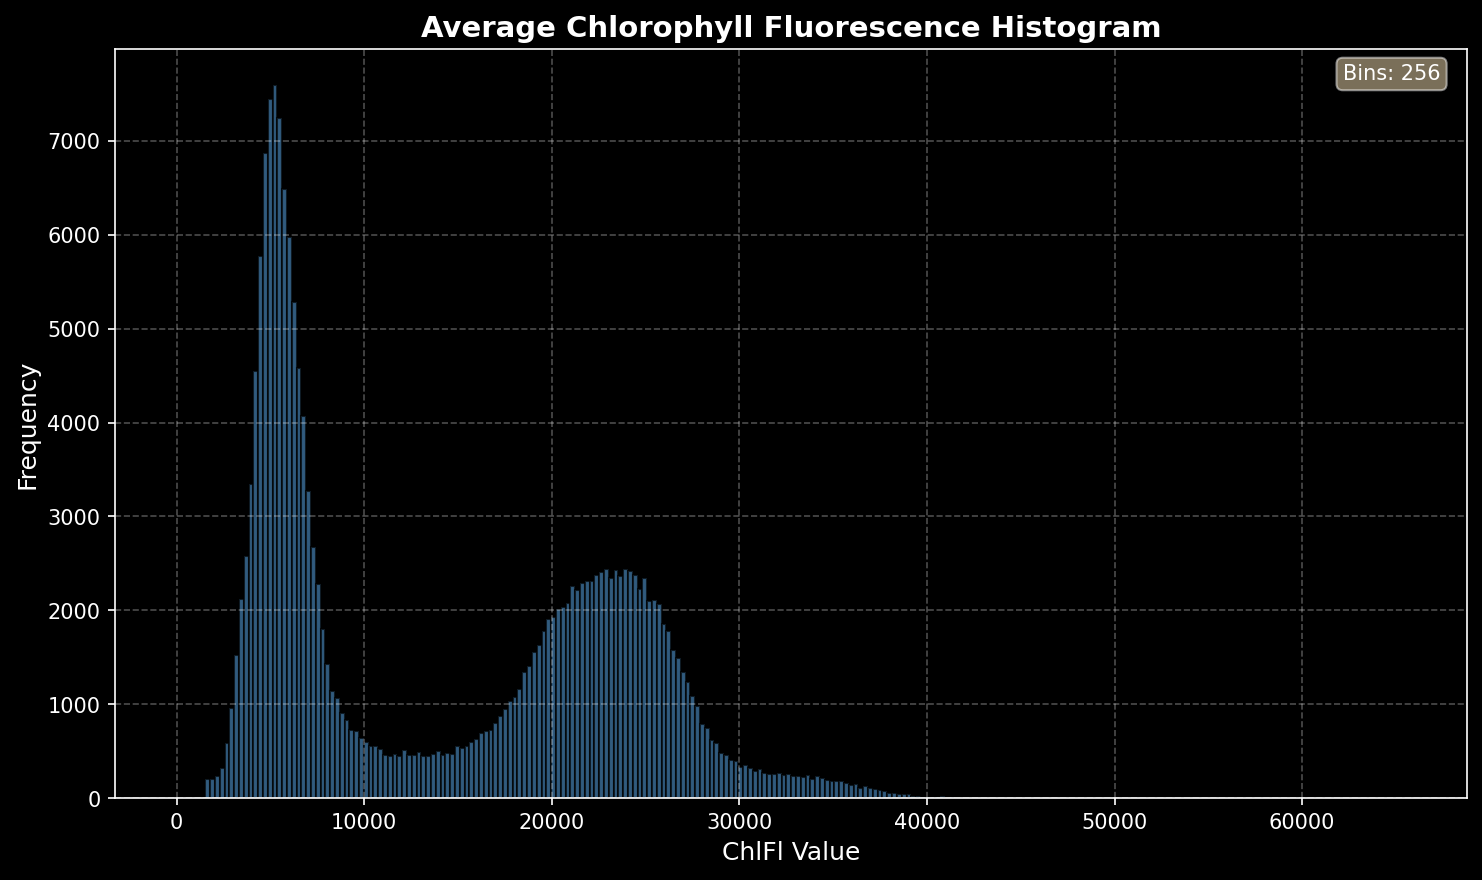
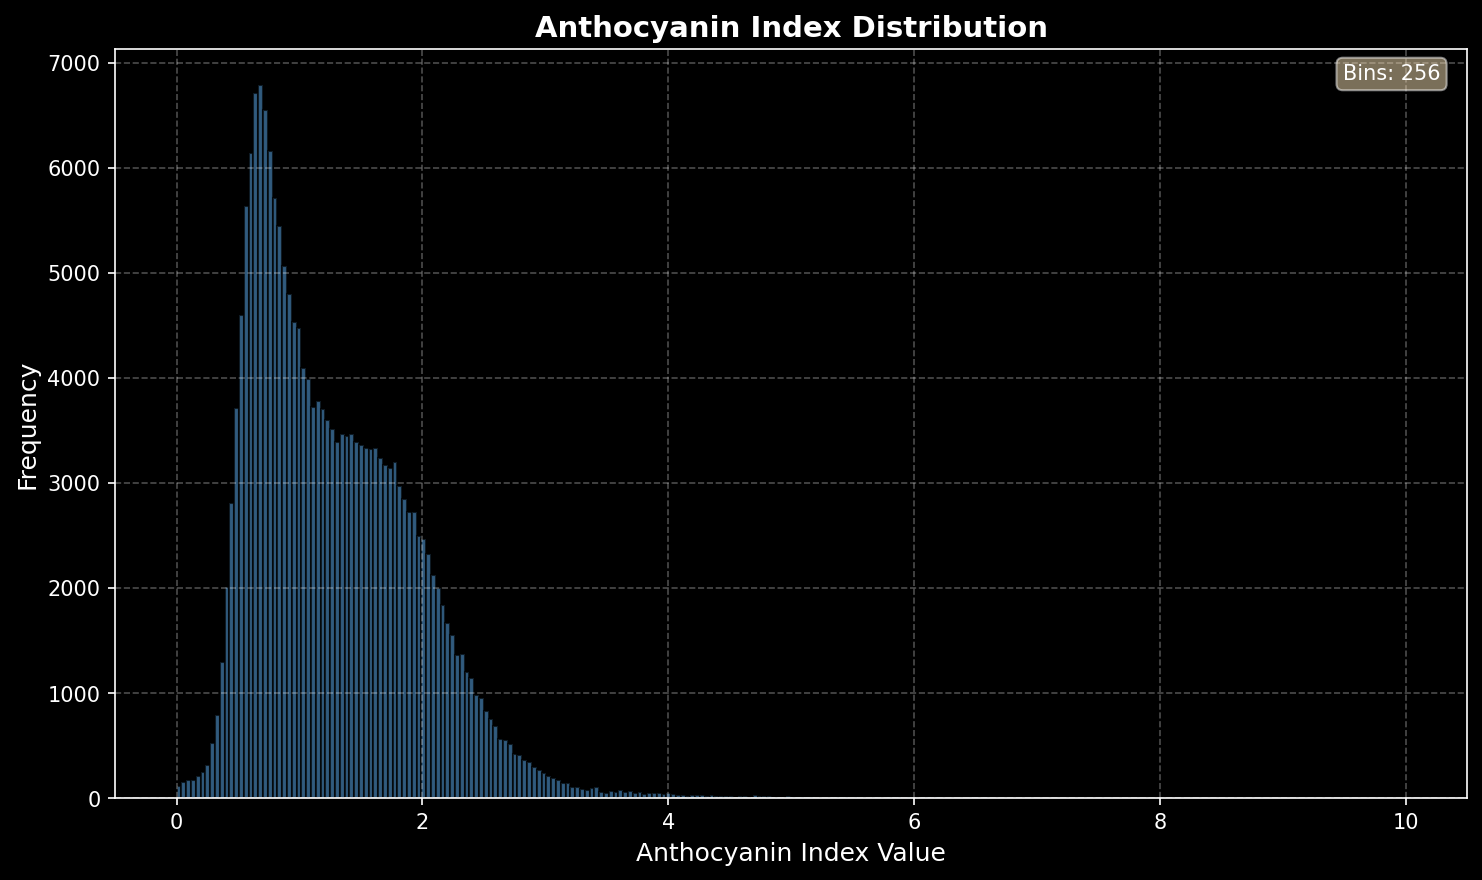
Histogram Export
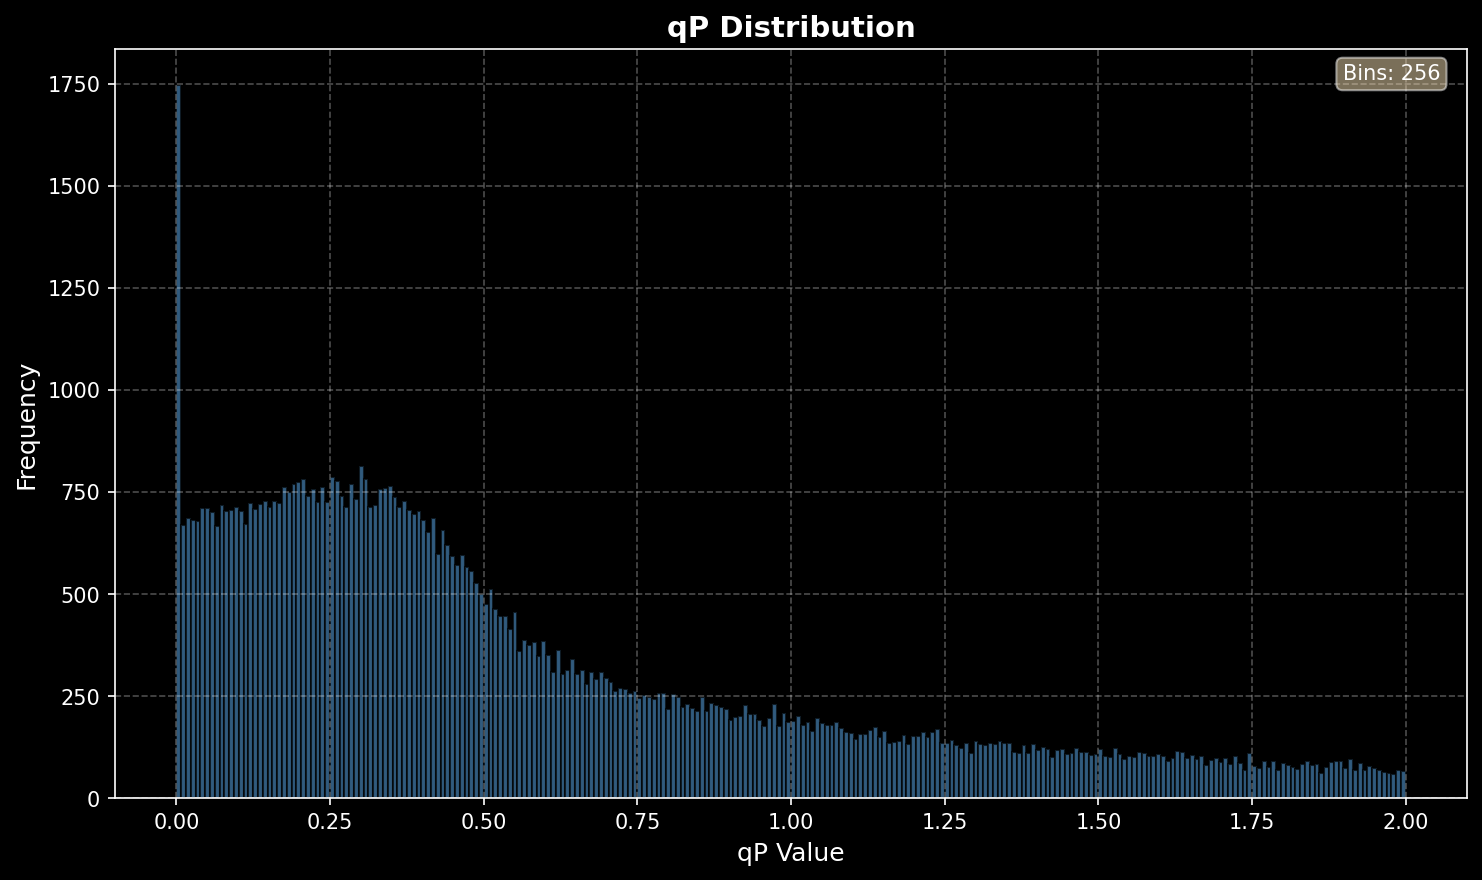
All images processed within our system are accompanied by automatically generated histograms. These histograms provide a clear, quantitative overview of the data behind each image, translating visual information into measurable distributions. This allows users to quickly assess variations in plant performance, identify shifts in intensity values, and detect subtle changes that may not be immediately visible in the image alone.
Each histogram is exported in two formats: as a high-quality image for quick visualization and reporting, and as a CSV file for in-depth data analysis. This gives users the flexibility to immediately interpret results visually or to further process the raw data in their preferred analysis tools.
Every histogram is directly linked to its corresponding image and includes the experiment number and trial name, ensuring full traceability of the dataset. This makes it easy to organize, compare, and revisit results across different experiments.
By combining image-based outputs with detailed, exportable data files, our system provides a complete and transparent view of plant responses, supporting both rapid insights and advanced analysis workflows.
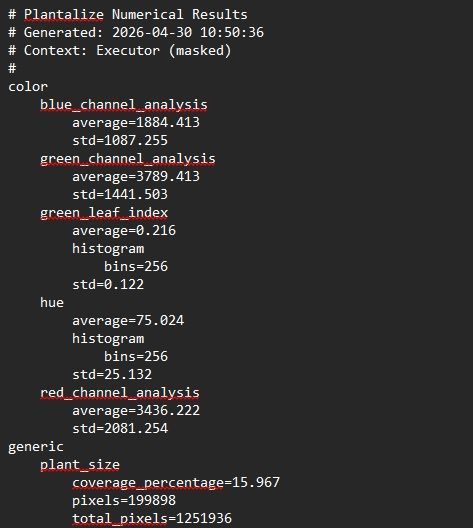
Average TXT File
With every analysis performed with PlantAlize, a text file is generated instantly, providing a clear summary of the results per plant. This file contains the average values for all measured indices, translating complex datasets into a structured and easy-to-use overview.
By calculating averages on a per-plant basis, users can quickly compare individual plants within an experiment and identify variations in performance, stress response, or development.
The generated text file is directly linked to the corresponding experiment and includes all relevant identifiers, such as the experiment number and trial name. This guarantees full traceability and allows for seamless integration into existing data workflows.
PlantAlize Free Tutorial
In this Tutorial we Explain the following:
- Opening Images
- Segmenting the plant
- Outcome of the analysis
Features Per Package

Do you have a question?
We are here to answer all your questions. Don't hesitate to contact our experts to find out everything about photosynthesis, color imaging and everything in between.