Chlorophyll fluorescence measuring methods: OJIP, part 2
In part 1, I explained why the fluorescence of a leaf rises in steps (O, J, I and P) when you switch on a strong light. That curve is nice, but a curve is hard to compare. With 200 plants you cannot observe 200 curves next to each other and see which plants are stressed.
In this part I show how we turn the curve into numbers. This is called the JIP test. The numbers describe what happens with the light energy that a leaf absorbs, so they tell you where in the photosynthetic machinery things go well, and where they do not.
In short
- The JIP test reads the fluorescence at a few fixed moments of the curve (O, J, I and P, and some points in between) and puts them in formulas. Every number has a physiological meaning.
- The numbers follow the energy through the leaf: how much light is absorbed, how much of it reaches each step, and how much is lost as heat.
- The performance index (PI) combines several of these steps in one number. It is one of the most sensitive OJIP parameters.
- Under stress many parameters change, but whether they go up or down depends on the species, the type of stress and how severe it is. So look at several parameters together. Spider plots and leaf models help with that.
What happens to light energy in a leaf?
The JIP parameters follow the path of light energy, from the moment a photon is absorbed. The energy can be used to drive photosynthesis, or it is lost as heat or as fluorescence. At every step along the way, some energy is used and some is lost.
We group the parameters in three types:
- Energy fluxes: how much energy flows through each step.
- Quantum yields: what fraction of all the absorbed energy reaches a certain step.
- Efficiencies: what fraction of the energy that reached one step continues to the next.
Energy fluxes: how much goes where?
A flux is an amount of energy flowing per second. The JIP test describes five of them:
- Absorption (ABS). Photons are caught by the antenna pigments. This creates excited chlorophyll.
- Trapping (TR). The energy of the excited chlorophyll is passed on to the reaction centre. There it starts the electron transport: QA takes up an electron.
- Electron transport (ET). Electrons that move on beyond QA, into the rest of the chain.
- Reduction of the end acceptors (RE). Electrons that arrive at the end of the chain, on the photosystem I side. (Scientists call taking up electrons "reduction".)
- Dissipation (DI). Energy that is lost as heat or as fluorescence. Most of it is heat; the fluorescence we measure is only a small part.
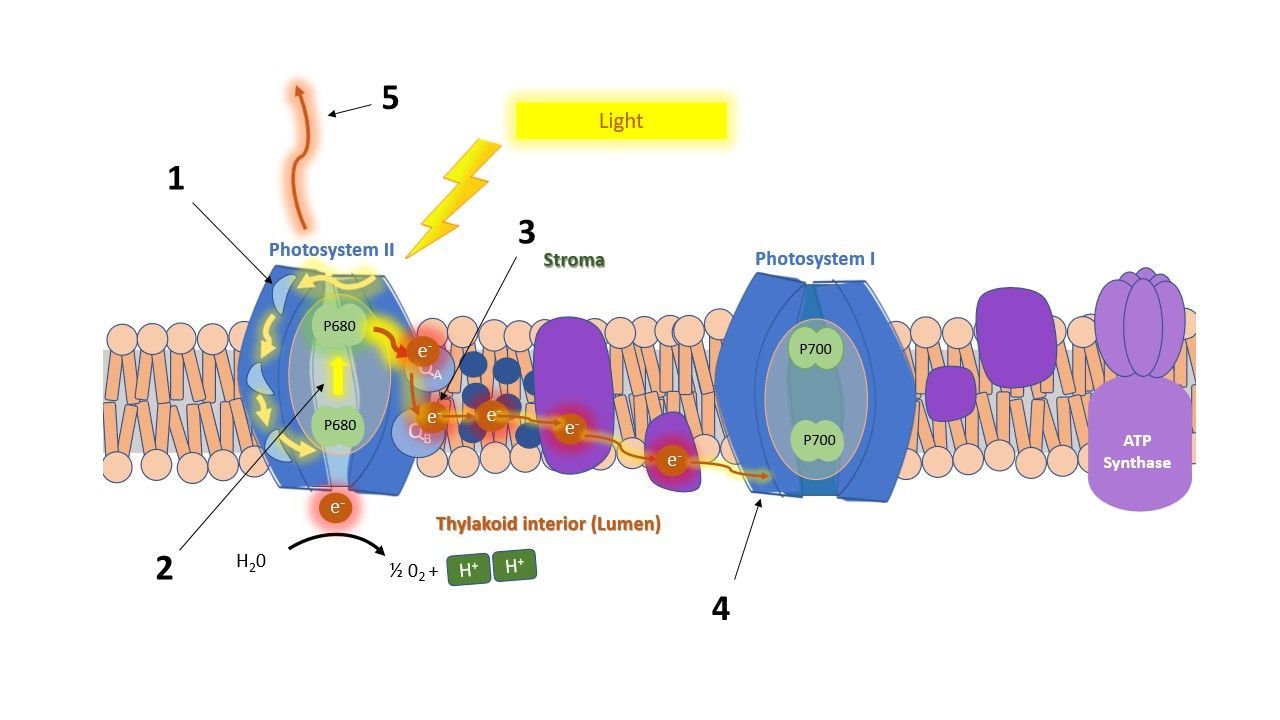
Yields and efficiencies: how much is used?
Fluxes tell you how much energy flows. Often it is more useful to know which fraction makes it to the next step. There are two kinds of fractions, and they are easy to mix up:
- A quantum yield (φ) counts from the start. It is the fraction of all absorbed photons that reaches a certain step.
- An efficiency (ψ or δ) counts from the previous step. It is the fraction of the energy that arrived at one step and continues to the next.
An example, with made-up numbers. Say a leaf absorbs 100 photons.
- 80 of them are trapped and fill QA. That is a yield of 80 / 100 = 0.80 (φP₀).
- Of those 80, 50 move an electron on beyond QA. Counted from the 80, that is an efficiency of 50 / 80 ≈ 0.63 (ψE₀). Counted from the original 100, it is a yield of 0.50 (φE₀).
- Of those 50 electrons, 25 reach the end acceptors on the photosystem I side. Counted from the 50, that is an efficiency of 25 / 50 = 0.50 (δR₀). Counted from the original 100, it is a yield of 0.25 (φR₀).
These numbers are only here to show the idea. They are not measurements.
The five parameters in words:
- φP₀, the maximum yield of the first step. How many of the absorbed photons fill QA. You will know it as Fv/Fm. In healthy leaves it is around 0.8.
- φE₀, the yield of electron transport. How many of the absorbed photons move an electron on beyond QA, into QB and the PQ pool.
- φR₀, the yield of the whole chain. How many of the absorbed photons end up as an electron at the end acceptors of photosystem I (FA/FB, ferredoxin or NADP⁺).
- ψE₀, the efficiency beyond QA. Of the trapped energy, how much moves an electron on beyond QA.
- δR₀, the efficiency towards the end acceptors. Of the electrons in the chain, how many reduce the end acceptors on the photosystem I side.
Together, these parameters show how well the photosynthetic machinery works. They are used, for example, to study how a compound acts on the plant, or what an environmental stress does.
Performance index: one number for the whole chain
Fv/Fm is not always sensitive enough to pick up early or small stress effects. The Performance Index (PI) was introduced for that reason. It puts several steps of photosynthesis in one number. Plant physiologists use it a lot to study the effect of biotic and abiotic stress. Breeders use it to screen many genotypes quickly, for example under drought or salt stress.
There are two versions.
• PI_ABS has three parts:
- The density of active reaction centres: how many working reaction centres there are for the light that is absorbed.
- The trapping efficiency: the chance that absorbed light fills QA.
- The efficiency of electron transport beyond QA.
• PI_total has these three parts and adds a fourth:
4. The efficiency of electron transport to the final acceptors on the photosystem I side.
The parts are multiplied. A problem in any one step lowers PI, and small drops in several steps add up. That is why PI reacts more strongly than a single parameter. This is partly maths. For the trapping part, PI does not use Fv/Fm itself, but φP₀ / (1 − φP₀): the part that is used divided by the part that is lost. If Fv/Fm falls from 0.83 to 0.78, a drop of 6%, this part of PI falls from 4.9 to 3.5, a drop of 27%.
One limit: PI tells you that something changed, not where. To find where, you need the individual parameters. That is what the next section is about.
What does stress do to the parameters?
To see how the parameters are used in practice, we went through some literature. We looked at how five types of stress change the JIP parameters: salt, drought, heat, cold and high light. The studies are listed in the references at the end.
Several parameters change under stress in many studies. But the direction of the change is not always the same. A parameter can go up in one species or situation and down in another. The pattern depends on the species, sometimes even on the cultivar, and on how severe the stress is. So the same stress does not always give the same pattern.
An overview of all results is in a table:
How do you read all these numbers?
There are a lot of parameters, and that is difficult to visualize. Still, it is worth looking at all of them. Each one reflects another part of the photosynthetic machinery, and a change in one part may not show up in another. So with several parameters side by side you can see where a change or stress response takes place.
Spider plots
A spider plot shows many parameters in one picture. Each spoke is one parameter, and each treatment is a line. Usually the control is the reference, so the lines show how far each treatment moves away from it. This makes it easy to see patterns, to compare treatments, and to spot the parameters that stress has changed.

The leaf model
Some studies draw the energy fluxes in a leaf model (Figure 2). In this drawing the width of an arrow shows how large a flux is:
- yellow: absorption
- light blue: trapping
- dark blue: electron transport
- red: dissipation
The black dots in the central square are reaction centres that are inactive ("silent").
The leaf model shows the fluxes per cross section. That means: per piece of leaf that was measured. So it also includes how many reaction centres are active.

The model is useful because one picture sums up the state of the photosynthetic machinery. In the example above, two barley cultivars were compared in high light and in low light. The cultivar ‘Arabi Aswad’ (left) copes better with high light: it has a larger electron transport flux, a smaller dissipation flux and more active reaction centres. The cultivar ‘Arabi Abiad’ (right) is better adapted to low light.
The membrane model
The same fluxes can also be shown per reaction centre (RC). This is the membrane model (Figure 3).

The two views tell you different things. Per cross section shows what the leaf as a whole is doing. Per reaction centre shows what each working unit is doing. Together they show whether a change comes from fewer working units, or from units that work differently.
An example: what happens when a leaf is heated?
Strasser describes the effect of heating in both models. (This is a summary in plain words.)
Per reaction centre (membrane model):
- Absorption per active reaction centre goes up. Some reaction centres have been switched off, so the active ones share the absorbed light.
- Dissipation per active reaction centre goes up. The switched-off centres lose all their energy as heat, and this heat is counted against the active ones.
- Electron transport per active reaction centre goes up. Heat speeds up the dark reactions, the enzyme reactions that use the electrons.
Per cross section (leaf model):
- The density of active reaction centres (RC/CS) goes down, because reaction centres are switched off.
- Electron transport per cross section goes down, for the same reason.
- Dissipation per cross section goes up.
- The absorbed energy per cross section (ABS/CS) goes down.
4. References
1. Strasser, R.J., Srivastava, A. And Govindjee (1995). Polyphasic chlorophyll a fluorescence transient in plants and cyanobacteria. Photochemistry and Photobiology 61: 32-42.
2. Strasser, R.J., Srivastava, A. And Tsimilli-Michael, M. (2000). The fluorescence transient as a tool to characterize and screen photosynthetic samples. In: Ynus, M. (Ed.) Probing Photosynthesis: Mechanisms, Regulation and Adaptation. Taylor and Francis, London: 445-483.
3. Strasser, R.J., Tsimilli-Micael, M. and Srivastava, A. (2004). Analysis of the Chlorophyll a fluorescence transient. In: Papageorgiou, G.C. and Govindjee (Eds.) Chlorophyll a fluorescence: a signature of photosynthesis. Springer, Dordrecht: 321-362.
4. Lotfi, R., H. M. Kalaji, G. R. Valizadeh, E. Khalilvand Behrozyar, A. Hemati, P. Gharavi‑Kochebagh, and A. Ghassemi. 2018. Effects of humic acid on photosynthetic efficiency of rapeseed plants growing under different watering conditions. Photosynthetica 56(3): 962–970. https://doi.org/10.1007/s11099-017-0745-9.
5. Zushi, K., S. Kajiwara, and N. Matsuzoe. 2012. Chlorophyll a fluorescence OJIP transient as a tool to characterize and evaluate response to heat and chilling stress in tomato leaf and fruit. Scientia Horticulturae 148: 39–46. https://doi.org/10.1016/j.scienta.2012.09.022.
6. Kalaji, H. M., A. Rastogi, M. Živčák, M. Brestič, A. Daszkowska‑Golec, K. Sitko, K. Y. Alsharafa, R. Lotfi, P. Stypiński, I. A. Samborska, and M. D. Cetner. 2018. Prompt chlorophyll fluorescence as a tool for crop phenotyping: an example of barley landraces exposed to various abiotic stress factors. Photosynthetica 56: 953–961. https://doi.org/10.1007/s11099-018-0766-z.
7. Chen, X., Y. Zhou, Y. Cong, P. Zhu, J. Xing, J. Cui, W. Xu, Q. Shi, M. Diao, and H.‑Y. Liu. 2021. Ascorbic acid‑induced photosynthetic adaptability of processing tomatoes to salt stress probed by fast OJIP fluorescence rise. Frontiers in Plant Science 12: 594400. https://doi.org/10.3389/fpls.2021.594400.
9. Stefanov, D., V. Petkova, and I. D. Denev. 2011. Screening for heat tolerance in common bean (Phaseolus vulgaris L.) lines and cultivars using JIP‑test. Scientia Horticulturae 128(1): 1–6. https://doi.org/10.1016/j.scienta.2010.12.003.
11. Jedmowski, C., and W. Brüggemann. 2015. Imaging of fast chlorophyll fluorescence induction curve (OJIP) parameters, applied in a screening study with wild barley (Hordeum spontaneum) genotypes under heat stress. Journal of Photochemistry and Photobiology B: Biology 151: 153–160. https://doi.org/10.1016/j.jphotobiol.2015.07.020.
13. Kalaji, H. M., A. Oukarroum, V. Alexandrov, M. Kouzmanova, M. Brestic, M. Zivcak, I. A. Samborska, M. D. Cetner, S. I. Allakhverdiev, and V. Goltsev. 2014. Identification of nutrient deficiency in maize and tomato plants by in vivo chlorophyll a fluorescence measurements. Plant Physiology and Biochemistry 81: 16–25. https://doi.org/10.1016/j.plaphy.2014.03.029.
14. Mehta, P., S. I. Allakhverdiev, and A. Jajoo. 2010. Characterization of photosystem II heterogeneity in response to high salt stress in wheat leaves (Triticum aestivum). Photosynthesis Research 105(3): 249–255. https://doi.org/10.1007/s11120-010-9588-y.
15. Jedmowski, C., A. Ashoub, and W. Brüggemann. 2013. Reactions of Egyptian landraces of Hordeum vulgare and Sorghum bicolor to drought stress, evaluated by the OJIP fluorescence transient analysis. Acta Physiologiae Plantarum 35: 345–354. https://doi.org/10.1007/s11738-012-1077-9.
16. Ren, J., P. Guo, X. Zhao, X. Ma, X. Ai, J. Wang, H. Zou, and H. Yu. 2025. Differential photosynthetic responses to drought stress in peanut varieties: insights from transcriptome profiling and JIP‑Test analysis. BMC Plant Biology 25: 957. https://doi.org/10.1186/s12870-025-06984-y.
17. Mihaljević, I., M. Viljevac Vuletić, V. Tomaš, Z. Zdunić, D. Vuković, and K. Dugalić. 2024. Assessment of photosynthetic capacity of two blackberry cultivars subjected to salt stress by the JIP fluorescence test. Journal of Berry Research 14(1): 1–13. https://doi.org/10.3233/JBR-230026.
18. Rastogi, A., M. Kovář, X. He, M. Živčák, S. Kataria, H. M. Kalaji, M. Skalicky, U. F. Ibrahimova, S. Hussain, S. Mbarki, and M. Brestic. 2020. JIP‑test as a tool to identify salinity tolerance in sweet sorghum genotypes. Photosynthetica 58(Special Issue): 518–528. https://doi.org/10.32615/ps.2019.169.
19. Ranjbarfordoei, A., R. Samson, and P. Van Damme. 2006. Chlorophyll fluorescence performance of sweet almond (Prunus dulcis (Miller) D. Webb) in response to salinity stress induced by NaCl. Photosynthetica 44(4): 513–522. https://doi.org/10.1007/s11099-006-0064-z.
20. Jafarinia, M., and M. Shariati. 2012. Effects of salt stress on photosystem II of canola plant (Brassica napus L.) probed by chlorophyll a fluorescence measurements. Iranian Journal of Science and Technology (Sciences) 36(1): 71–76. https://doi.org/10.22099/ijsts.2012.2058.
21. Zushi, K., and N. Matsuzoe. 2017. Using of chlorophyll a fluorescence OJIP transients for sensing salt stress in the leaves and fruits of tomato. Scientia Horticulturae 219: 216–221. https://doi.org/10.1016/j.scienta.2017.03.016.
22. Giorio, P., and M. H. Sellami. 2021. Polyphasic OKJIP chlorophyll a fluorescence transient in a landrace and a commercial cultivar of sweet pepper (Capsicum annuum L.) under long‑term salt stress. Plants 10(5): 887. https://doi.org/10.3390/plants10050887.
23. Akhter, M. S., S. Noreen, S. Mahmood, H.‑u‑R. Athar, M. Ashraf, A. A. Alsahli, and P. Ahmad. 2021. Influence of salinity stress on PSII in barley (Hordeum vulgare L.) genotypes, probed by chlorophyll‑a fluorescence. Journal of King Saud University – Science 33(1): 101239. https://doi.org/10.1016/j.jksus.2020.101239.
24. Zhang, T., H. Gong, X. Wen, and C. Lu. 2010. Salt stress induces a decrease in excitation energy transfer from phycobilisomes to photosystem II but an increase to photosystem I in the cyanobacterium Spirulina platensis. Journal of Plant Physiology 167(12): 951–958. https://doi.org/10.1016/j.jplph.2009.12.020.
25. Weng, H., M. Wu, X. Li, L. Wu, J. Li, T. O. Atoba, J. Zhao, R. Y. Wu, and D. Ye. 2023. High‑throughput phenotyping salt tolerance in JUNCAOs by combining prompt chlorophyll a fluorescence with hyperspectral spectroscopy. Plant Science 330: 111660. https://doi.org/10.1016/j.plantsci.2023.111660.
26. Chen, X., X. Liu, Y. Cong, Y. Jiang, J. Zhang, Q. Yang, and H. Liu. 2025. Melatonin alleviates photosynthetic injury in tomato seedlings subjected to salt stress via OJIP chlorophyll fluorescence kinetics. Plants 14(5): 824. https://doi.org/10.3390/plants14050824.
27. Antunović Dunić, J., Mlinarić, S., Pavlović, I., Lepeduš, H., and Salopek‑Sondi, B. 2023. Comparative analysis of primary photosynthetic reactions assessed by OJIP kinetics in three Brassica crops after drought and recovery. Applied Sciences 13(5): 3078. https://doi.org/10.3390/app13053078.
28. Zhang, R. H., Zhang, X. H., Camberato, J. J., and Xue, J. Q. 2015. Photosynthetic performance of maize hybrids to drought stress. Russian Journal of Plant Physiology 62: 788–796. https://doi.org/10.1134/S1021443715060187.
29. Meng, L.‑L., Song, J.‑F., Wen, J., Zhang, J., and Wei, J.‑H. 2016. Effects of drought stress on fluorescence characteristics of photosystem II in leaves of Plectranthus scutellarioides. Photosynthetica 54(3): 414–421. https://doi.org/10.1007/s11099‑016‑0191‑0.
30. Zhou, R., Kan, X., Chen, J., Hua, H., Li, Y., Ren, J., Feng, K., et al. 2019. Drought‑induced changes in photosynthetic electron transport in maize probed by prompt fluorescence, delayed fluorescence, P700 and cyclic electron flow signals. Environmental and Experimental Botany 158: 51–62. https://doi.org/10.1016/j.envexpbot.2018.11.005.
31. Liu, J., Li, H. J., Guo, Y. Y., Wang, G. X., Zhang, H. J., Zhang, R. H., and Xu, W. H. 2018. Effects of drought stress on the photosynthesis in maize. Russian Journal of Plant Physiology 65: 849.
32. Zhang, K., Chen, B‑h., Hao, Y., Yang, R., and Wang, Y‑a. 2018. Effects of short‑term heat stress on PSII and subsequent recovery for senescent leaves of Vitis vinifera L. cv. Red Globe. Journal of Integrative Agriculture 17(12): 2683–2693. https://doi.org/10.1016/S2095‑3119(18)62143‑4.
33. Zhang, L., Hu, T., Amombo, E., Wang, G., Xie, Y., and Fu, J. 2017. The alleviation of heat damage to photosystem II and enzymatic antioxidants by exogenous spermidine in tall fescue. Frontiers in Plant Science 8: 1747. https://doi.org/10.3389/fpls.2017.01747.
34. Fan, Q., and Jespersen, D. 2023. Assessing heat tolerance in creeping bentgrass lines based on physiological responses. Plants 12(1): 41. https://doi.org/10.3390/plants12010041.
35. Tan, W., Meng, Q‑W., Brestič, M., Olsovská, K., and Yang, X. 2011. Photosynthesis is improved by exogenous calcium in heat‑stressed tobacco plants. Journal of Plant Physiology 168: 2063–2071. https://doi.org/10.1016/j.jplph.2011.06.009.
36. Arslan, Ö. 2023. The role of heat acclimation in thermotolerance of chickpea cultivars: Changes in photochemical and biochemical responses. Life 13(1): 233. https://doi.org/10.3390/life13010233.
37. Mihaljević, I., Viljevac Vuletić, M., Tomaš, V., Vuković, D., and Zdunić, Z. 2025. Characterization of heat tolerance in two apple rootstocks using chlorophyll fluorescence as a screening method. Agronomy 15(6): 1442. https://doi.org/10.3390/agronomy15061442.
38. Kalaji, H. M., Carpentier, R., Allakhverdiev, S. I., and Bosa, K. 2012. Fluorescence parameters as early indicators of light stress in barley. Journal of Photochemistry and Photobiology B: Biology 112: 1–6. https://doi.org/10.1016/j.jphotobiol.2012.03.009.
39. Lee, J. H., Cabahug, R. A. M., You, N. H., and Nam, S. Y. 2021. Chlorophyll fluorescence and growth evaluation of ornamental foliage plants in response to light intensity levels under continuous lighting conditions. Flower Research Journal 29(4): 320–322. https://doi.org/10.11623/frj.2021.29.3.05.
40. Bayat, L., Arab, M., Aliniaeifard, S., Seif, M., Lastochkina, O., and Li, T. 2018. Effects of growth under different light spectra on the subsequent high light tolerance in rose plants. AoB Plants 10(5): ply052. https://doi.org/10.1093/aobpla/ply052.
41. Ceusters, N., Valcke, R., Frans, M., Claes, J. E., Van den Ende, W., and Ceusters, J. 2019. Performance Index and PSII connectivity under drought and contrasting light regimes in the CAM orchid Phalaenopsis. Frontiers in Plant Science 10: 1012. https://doi.org/10.3389/fpls.2019.01012.
42. Faseela, P., and Puthur, J. T. 2016. Chlorophyll a fluorescence changes in response to short‑ and long‑term high‑light stress in rice seedlings. Photosynthetica 54(3): 549–558.
43. Faseela, P., and Puthur, J. T. 2018. The imprints of the high light and UV‑B stresses in Oryza sativa L. ‘Kanchana’ seedlings are differentially modulated. Journal of Photochemistry and Photobiology B: Biology 178: 551–559. https://doi.org/10.1016/j.jphotobiol.2017.12.009.
44. Mlinarić, S., Antunović Dunić, J., Skendrović Babojelić, M., Cesar, V., and Lepeduš, H. 2017. Differential accumulation of photosynthetic proteins regulates diurnal photochemical adjustments of PSII in common fig (Ficus carica L.) leaves. Journal of Plant Physiology 209: 1–10. https://doi.org/10.1016/j.jplph.2016.12.002.
45. Lu, T., Yu, H., Li, Q., Chai, L., and Jiang, W. 2019. Improving plant growth and alleviating photosynthetic inhibition and oxidative stress from low‑light stress with exogenous GR24 in tomato (Solanum lycopersicum L.) seedlings. Frontiers in Plant Science 10: 490. https://doi.org/10.3389/fpls.2019.00490.
46. Li, L., Li, X.‑Y., Xu, X.‑W., Lin, L.‑S., Zeng, F.‑J., and Chen, F.‑L. 2013.
Assimilative branches and leaves of the desert plant Alhagi sparsifolia Shap. possess a different adaptation mechanism to shade.
Plant Physiology and Biochemistry 74: 239–245. https://doi.org/10.1016/j.plaphy.2013.11.009.
47. Liang, Y., Chen, H., Tang, M., Yang, P., and Shen, S. 2007. Responses of Jatropha curcas seedlings to cold stress: photosynthesis‑related proteins and chlorophyll fluorescence characteristics. Physiologia Plantarum 131(3): 508–517. https://doi.org/10.1111/j.1399‑3054.2007.00974.x.
48. Huang, X., Shi, H., Hu, Z, Liu, A., Amombo, E., Chen, L., and Fu, J. 2017. ABA is involved in regulation of cold stress response in Bermudagrass. Frontiers in Plant Science 8: 1613. https://doi.org/10.3389/fpls.2017.01613.
49. Mazur, M., Matoša Kočar, M., Jambrović, A., Sudarić, A., Volenik, M., Duvnjak, T., and Zdunić, Z. 2024. Crop‑specific responses to cold stress and priming: Insights from chlorophyll fluorescence and spectral reflectance analysis in maize and soybean. Plants 13(9): 1204. https://doi.org/10.3390/plants13091204.
50. Fan, J., Hu, Z., Xie, Y., Chan, Z., Chen, K., Amombo, E., Chen, L., and Fu, J. 2015. Alleviation of cold damage to photosystem II and metabolisms by melatonin in Bermudagrass. Frontiers in Plant Science 6: 925. https://doi.org/10.3389/fpls.2015.00925.
51. Li, J., Muneer, M. A., Sun, A., Guo, Q., Wang, Y., Huang, Z., Li, W., and Zheng, C. 2023. Magnesium application improves the morphology, nutrient uptake, photosynthetic traits, and quality of tobacco (Nicotiana tabacum L.) under cold stress. Frontiers in Plant Science 14: 1078128. https://doi.org/10.3389/fpls.2023.1078128.
52. Sun, L., Li, X., Wang, Z., Sun, Z., Zhu, X., Liu, S., Song, F., Liu, F., and Wang, Y. 2018. Cold priming induced tolerance to subsequent low temperature stress is enhanced by melatonin application during recovery in wheat. Molecules 23(5): 1091. https://doi.org/10.3390/molecules23051091.
53. Tsimilli-Michael, M. (2020). Revisiting JIP-test: An educative review on concepts, assumptions, approximations, definitions and terminology. PHotosynthetica 58: 275-292.