Chlorophyll fluorescence measuring methods: OJIP, part 1
In short
- In an OJIP measurement, a dark-adapted leaf gets one second of extremely bright light, and we follow how its fluorescence climbs.
- The curve rises in steps, called O, J, I and P. Each step shows the flow of electrons in photosynthesis.
- From the shape of the curve we calculate how well the photosynthetic machinery works. Part 2 explains those parameters.
Why look at fluorescence?
Chlorophyll fluorescence is a fast, non-destructive way to observe how efficiently a plant uses light. It is used to screen plants, for example when breeding a new cultivar or testing a new product. High-tech greenhouses use it as direct feedback from the plant to steer climate and lighting. Ecology, forestry and arable farming use it too, with drones and satellites (solar-induced fluorescence, SIF).
Our CF2GO and PlantExplorer systems measure chlorophyll fluorescence with two protocols: PAM and OJIP. Both protocols measure a minimum and a maximum fluorescence level. PAM measures just those two levels (see our PAM blog). OJIP follows the whole rise from minimum to maximum, in detail.
That rise was first described by Kautsky and Hirsch in 1931, and it is known in the literature as the Kautsky effect. It looks simple, but it carries a surprising amount of information about how a plant handles light energy. The model that we use was developed by Strasser and colleagues (Strasser et al., 1995). In this part, I explain the model. In part 2, I explain the parameters we calculate with it.
Why does fluorescence go up? The basic idea
A leaf that absorbs light can do three things with that energy (Figure 1):
- use it for photosynthesis,
- release it as heat,
- release it as a tiny bit of red light: fluorescence.
When photosynthesis uses less of the energy, more of it is lost as heat and fluorescence. So fluorescence goes up whenever photosynthesis 'gets stuck'. That is what the OJIP curve shows: the moments when the electron flow of photosynthesis gets stuck, and where.

The electron transport chain in one minute
In photosystem II (PSII), light energy is used to push an electron from the reaction centre onto a chain of electron-carriers (Figure 2). The electron travels along the chain, like a car on a road with 'merging sections'. The 'sections' in the order that matter for OJIP are:
- QA: the first carrier in PSII. It holds only one electron at a time.
- QB: the second carrier. It needs two electrons before it moves on.
- PQ pool: a stock of small carriers (plastoquinone) that float in the membrane.
- Cytochrome b6f: a protein complex that takes the electrons from the PQ pool, but only at a limited speed.
- Plastocyanin (PC) and photosystem I (PSI): the next stations.
- Ferredoxin, FNR and NADPH: the end of the road, where the electrons are finally put to use (ATP and NADPH)
When a 'section' is blocked, the light energy that arrives cannot get through and turns back. That "turning back" is what we see as extra fluorescence.

How the measurement works
A leaf that has been in the dark gets an extremely bright flash of light for one second. A camera (or photodiode) with a sensitive sensor and a filter records the weak fluorescence signal that comes from the plant.
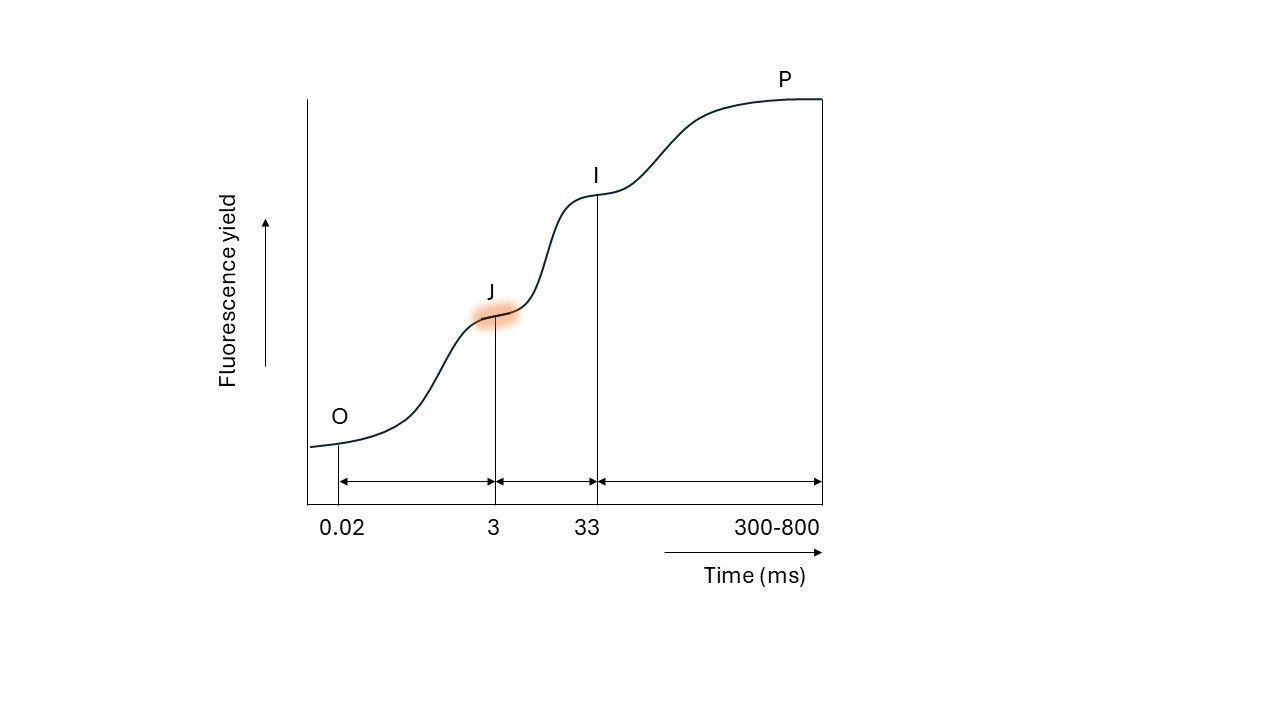
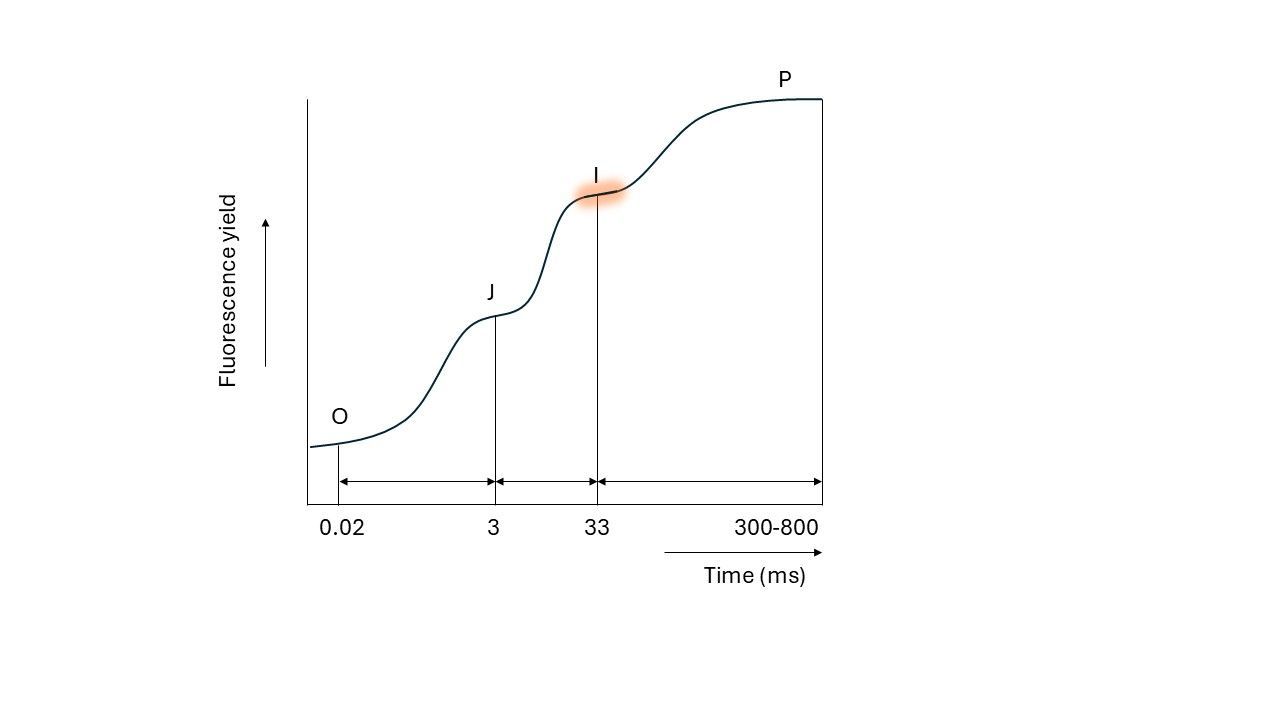
The signal does not rise in a straight line. Most of the action happens in the first thousandths of a second, so we plot time on a logarithmic axis, where each step to the right is ten times later. Then the following pattern appears:

The fluorescence climbs in three steps, which Strasser called triphasic kinetics. It reaches a first plateau, J, after about 3 milliseconds, and a second plateau, I, after about 33 milliseconds. The last plateau, P, is the peak or maximum fluorescence, after roughly 300 to 800 milliseconds. The start of the curve is called O, for origin.
O: the start of the curve (Fo)
At the very start of the flash, all QA are still 'empty' (also called 'oxidized'). We call this state "open". Most of the absorbed light energy can be used for photosynthesis, and only a small fraction falls back as fluorescence. That small signal is the minimal fluorescence, Fo (the O stands for origin). It is measured within 50 microseconds from the onset of the flash.
In short: the road is free everywhere, so the fluorescence is at its lowest.
O to J: a queue forms at QA
When a photosystem absorbs light, the energy reaches the reaction centre within a few femtoseconds. The reaction centre sends the energy to an electron, which moves to QA, and water splitting then supplies a new electron in the reaction center to replace it.
Now QA is 'occupied' (also called 'reduced), which we call "closed". It cannot accept another electron until it has passed the first one on to QB. But absorbing light is much faster than passing electrons on. So during the flash, energy that arrives at a photosystem with a closed QA cannot be used for photosynthesis. It falls back and is released as fluorescence (remember the three fates of energy).
The more QA are closed, the more fluorescence we see. That is the rise from O to J.
In short: QA fills faster than it empties, so a queue forms at the first merging section and fluorescence rises.
J-plateau: QA empties as fast as it fills
After about 3 milliseconds, QA starts to pass its electrons to QB. That frees QA again, so light energy can be used for photosynthesis again and less of it is lost as fluorescence. For a short moment QA is emptied as fast as it is filled. The fluorescence stays level: this is the J plateau.
J to I: the PQ pool fills up
QB needs two electrons before it can move on. When it has them, it takes up two protons (H⁺) from the stroma, the fluid outside the thylakoid membrane, and becomes plastoquinol (PQH₂). PQH₂ leaves photosystem II and joins the PQ pool in the membrane. A new plastoquinone takes its place at QB.
Cytochrome b6f takes the electrons from the PQ pool, but only at a limited speed. That is a bottleneck. PQH₂ piles up in the pool, QB stays occupied, and QA cannot pass on its electrons. More and more QA stay closed, so more light energy turns back as fluorescence. That is the rise from J to I.
In short: electrons arrive in the PQ pool faster than cytochrome b6f can take them on, so the queue grows again.
I-plateau: electrons move on to photosystem I
After about 30 milliseconds, plastocyanin (PC) and photosystem I (PSI) start to take electrons from cytochrome b6f. PSI uses them, together with its own captured light energy, to make NADPH, a key product of the light reactions of photosynthesis.
With the electrons flowing on, there is room again. QA empties about as fast as it is filled, and the fluorescence stays level: this is the I plateau.
I to P: the end of the road is closed
But the flow does not keep up for long. After the previous period of darkness, the reactions behind photosystem I are still 'switched off'. This includes FNR, the enzyme that makes NADPH, and the enzymes of the Calvin cycle. They need light and some time to switch on, and how long differs between species. Under the extremely bright light of the saturation pulse, electrons pile up at this end of the chain.
Finally the whole chain is full. All electron carriers are occupied and cannot accept more electrons, and photosynthesis is completely blocked. No light energy can be used any more, and it is released as fluorescence. The fluorescence reaches its maximum, Fm: the P peak.
In short: the end of the road is still closed, so the whole road jams and fluorescence reaches its maximum.
What can we do with this?
During the one-second flash we can follow many processes in the plant. From the plateaus and the shape of the curve, we can calculate how well the photosynthetic machinery works. Strasser, his colleagues and other researchers developed more than 20 parameters for this. They range from the overall efficiency of the system to single processes, for example:
- Light absorption and trapping: the size of the antenna, and how much energy reaches the reaction centres.
- Reaction centres: how many there are per chlorophyll, how many are open, and how efficient each one is.
- Electron transport: how many electrons move on per reaction centre, and how efficiently they reach the different carriers.
- Energy conversion: how much energy is used for photochemistry and how much is lost.
Stress, such as drought, heat, salt, pests and diseases, changes how this system works, so it can show up in these measurements. The effect of a product on the plant can also be quantified.
In part 2 of the OJIP blog, I explain the parameters that we calculate from the OJIP rise, what they mean, and what stress does to them.
References
• Kautsky, H. and Hirsch, A. (1931). Neue Versuche zur Kohlensäureassimilation. Naturwissenschaften 19: 964.
• Strasser, R.J., Srivastava, A. And Govindjee (1995). Polyphasic chlorophyll a fluorescence transient in plants and cyanobacteria. Photochemistry and Photobiology 61: 32-42.
• Strasser, R.J., Srivastava, A. And Tsimilli-Michael, M. (2000). The fluorescence transient as a tool to characterize and screen photosynthetic samples. In: Ynus, M. (Ed.) Probing Photosynthesis: Mechanisms, Regulation and Adaptation. Taylor and Francis, London: 445-483.
• Strasser, R.J., Tsimilli-Micael, M. and Srivastava, A. (2004). Analysis of the Chlorophyll a fluorescence transient. In: Papageorgiou, G.C. and Govindjee (Eds.) Chlorophyll a fluorescence: a signature of photosynthesis. Springer, Dordrecht: 321-362.
• Tsimilli-Michael, M. (2020). Revisiting JIP-test: An educative review on concepts, assumptions, approximations, definitions and terminology. PHotosynthetica 58: 275-292.