
Heat stress in tomato: what the OJIP curve picks up within one day
Why look at heat stress?
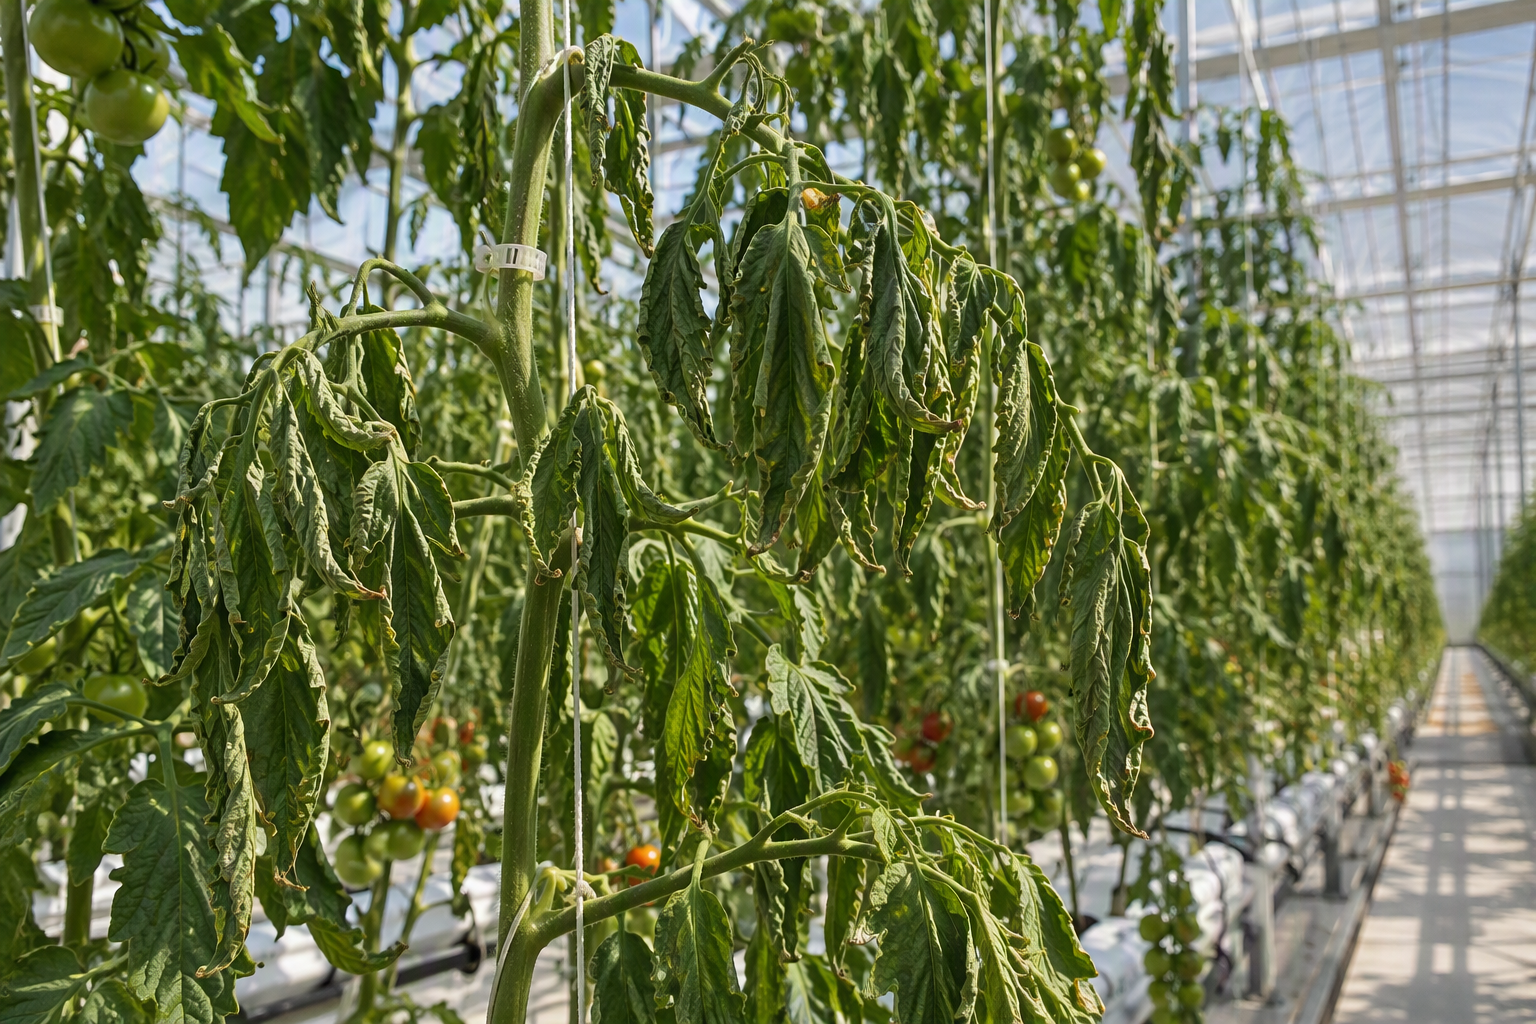
Heat waves are becoming more common, and keeping crops healthy and productive during one is a big challenge. That is why breeders are looking for cultivars that are more tolerant to higher temperatures, without losing yield. But selecting the right cultivars takes a lot of time. Often, it is scored by eye, or increasingly with colour or multispectral imaging. However, in our experience, it takes two to three weeks before the plants start to show symptoms.
Photosynthesis is much faster, so chlorophyll fluorescence should pick up the stress sooner. That is what Arjen Tegels tested during his MSc internship at PhenoVation.
What we did
Tomato plants (cv. Moneymaker) were grown in a climate cabinet at 25/20 °C (day/night) and 300 µmol m⁻² s⁻¹ of white LED light. After a week of baseline measurements, we raised the temperature to 35/24 °C.
Every day, we measured the plants with a PlantExplorer, fitted with a faster camera (minimal 333 frames per second). This allowed us to image the OJIP rise (see our OJIP posts, part 1 and part 2) across the whole plant, instead of at one spot on one leaf. From each curve, 28 parameters about photosynthesis were calculated.
Dark-adapted plants were measured after 30 minutes, 5 hours and 7 hours of darkness. Light-adapted plants were measured at dawn and at the end of the day. The same plants were also imaged for colour and multispectral (hue and NDVI) with a PlantExplorer PRO+.
OJIP picks up stress within one day
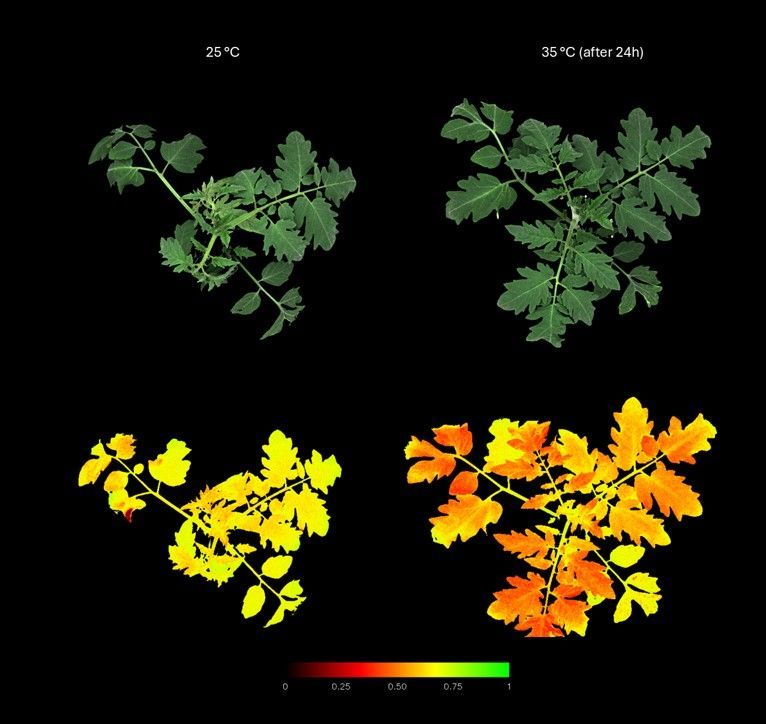
After a single day at 35 °C, the chlorophyll fluorescence images already showed heat stress. Colour and NDVI did not show anything in the full 10 days.
Hue and NDVI actually increased, which would suggest greener, healthier plants. Some leaves did curl, however. This showed their lighter underside to the camera, which shifts the colour and NDVI values slightly.
δRo and PItotal: the clearest signal
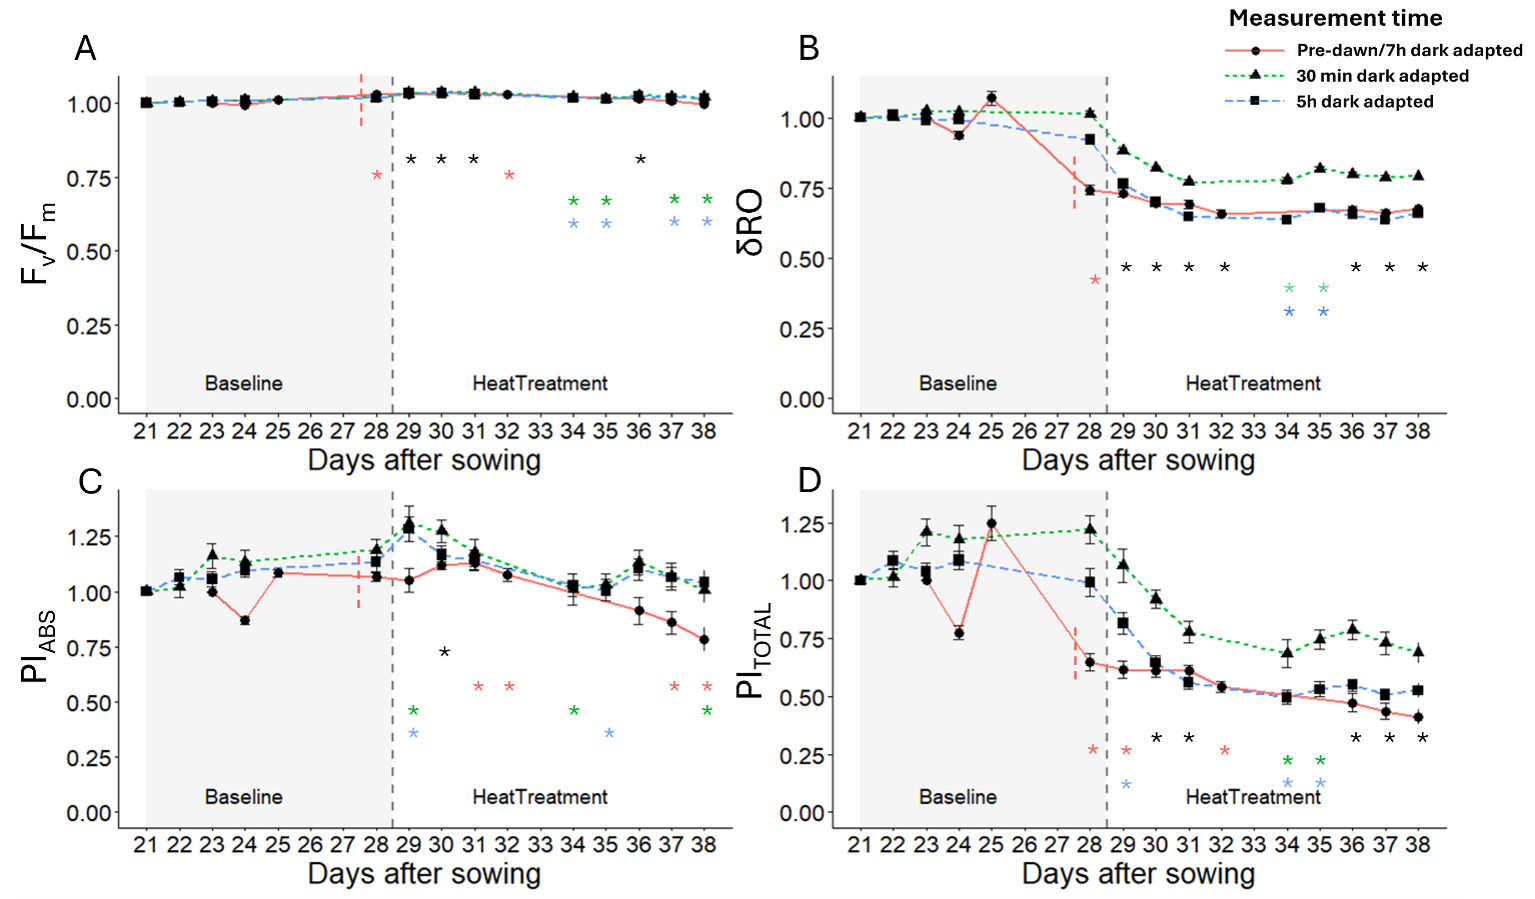
δRo, the efficiency with which electrons reach the end acceptors of photosystem I, dropped after one day of heat. It did so at all three dark-adaptation times, just as fast after 30 minutes of darkness as after 7 hours.
PItotal (which includes δRo) also dropped after one day when measured after 5 or 7 hours of darkness. After 30 minutes of darkness, it took two days. Both parameters stayed clearly below the baseline for the rest of the treatment. By day 10, δRo was about 20–35% lower and PItotal about 30–60% lower, depending on the dark-adaptation time.
Fv/Fm and PIABS missed it
Fv/Fm is the most used stress parameter, but it barely moved. It even went up slightly in the first days of heat, and PIABS rose at first too.
The difference between PIABS and PItotal is exactly the δRo parameter. That suggests heat hit the end of the electron transport chain, after photosystem II, which Fv/Fm does not look at.
In light: also look at the spread of the pixels, not only the mean
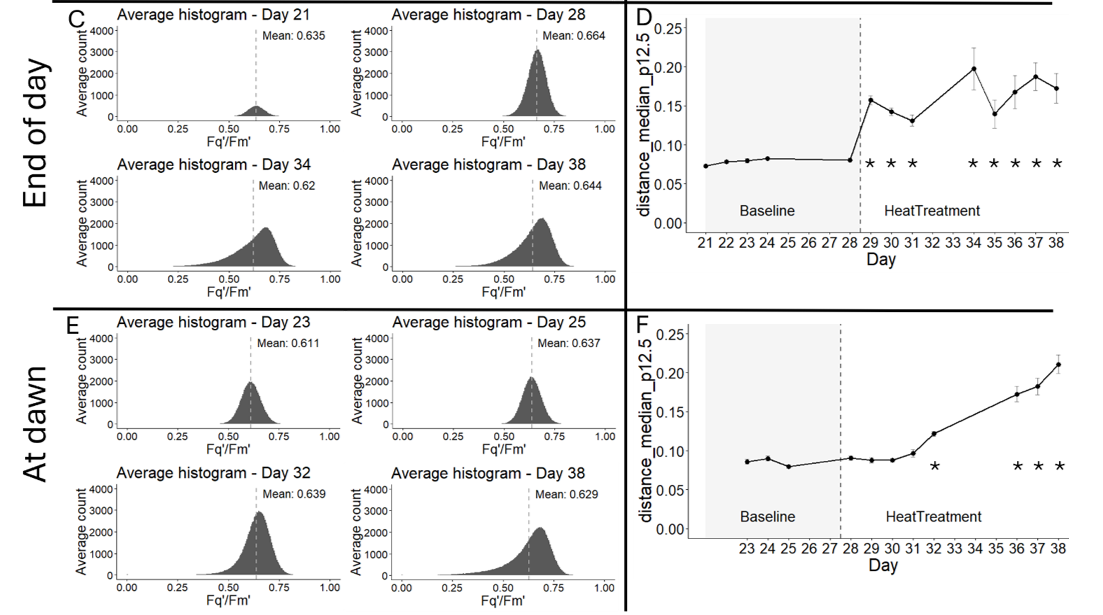
In light-adapted plants, the average Fq'/Fm' (ΦPSII) did not change. However, the images told a different story. Some leaves had much lower efficiency, while others stayed the same or even improved. The average hid that effect.
So instead of the mean, Arjen also looked at the histogram, specifically, how far the 12.5th percentile (lowest part of the data) sits below the median. At the end of the day, that spread doubled from 0.08 to 0.16 after a single day of heat. At dawn, it took three days, probably because damage builds up over the day.
What to take from this experiment
- Chlorophyll fluorescence imaging picked up heat stress in tomato within one day. Colour and NDVI did not show it within ten days.
- δRo and PItotal gave the clearest signal. Fv/Fm alone would have missed it.
- In light, look at how the values are spread across the plant, not only at the average.
Read the full report here: