Chlorophyll Fluorescence measuring methods: PAM fluorometry
Chlorophyll Fluorescence Measuring Methods
Measuring protocols for chlorophyll fluorescence have been developed over the last century by biophysicists in scientific studies. In the past 20 years, this fundamental research has been implemented into field applications. Various approaches have been developed to analyze different aspects of the photosynthetic process, and can be broadly categorized into three types: single turnover flashes, fast induction of chlorophyll fluorescence, and photosynthetic steady-state quenching analysis.
While these types can be combined, they are most commonly implemented through two popular technical platforms: Pulse-Amplitude Modulation (PAM), and the fast polyphasic rise of fluorescence by continuous excitation (called OJIP).
From 2009 to 2019, a total of 4490 scientific papers were published using chlorophyll fluorescence techniques (Zavafer et al. 2020). From those papers, PAM was used in 2459 papers (55% of all publications), and OJIP accounted for 1073 papers (24%).
In this blog, we will delve into the most widely adopted method: PAM fluorometry.
PAM Fluorometry
The PAM fluorometry protocol uses modulated light to measure fluorescence. The measuring light consists of very short pulses (in the microsecond range) that can be applied at different frequencies. These measuring pulses itself are so short that they have no impact on photosynthesis, ensuring that the fluorescence yield reliably reflects the plant’s photosynthetic activity under various photochemical scenarios.
Figure 1 gives an overview of the PAM fluorometry protocol, divided into sections covering dark adapted measurements, light adapted measurements, and dark recovery measurements. We will highlight each section below.
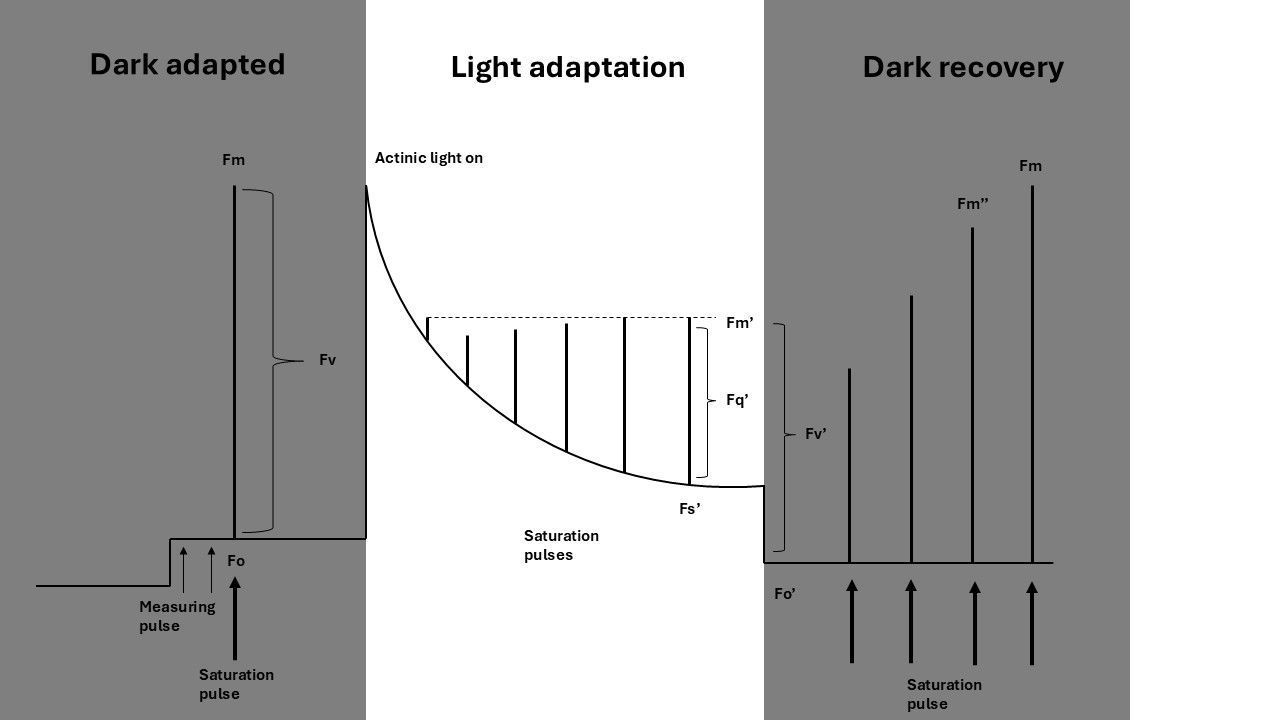
PAM - Dark Adapted Measurement
A parameter from chlorophyll fluorescence analysis that is used a lot in science is the potential maximum efficiency of photosystem II (Fv/Fm). Photosystem II (PSII) is a key component of photosynthesis, and responsible for splitting water and transferring excited electrons (see introduction blog). Fv/Fm therefore serves as a measure of plant photosynthetic potential, and reflects the plant’s ability to fully utilize light when all photosystems are open. To ensure all photosystems are open, the plant must be kept in complete darkness for 15-30 minutes or longer. This period allows for the release of any previous quenching, making the measurement possible.
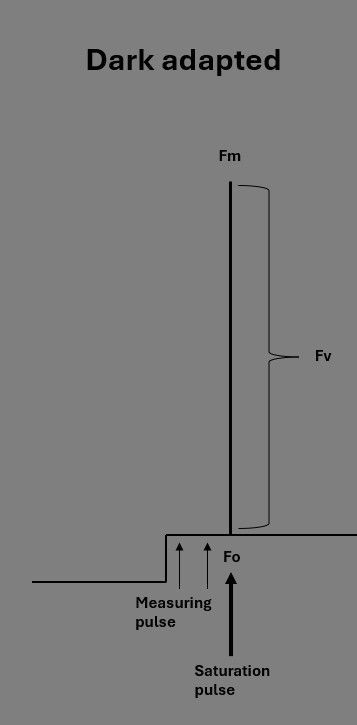
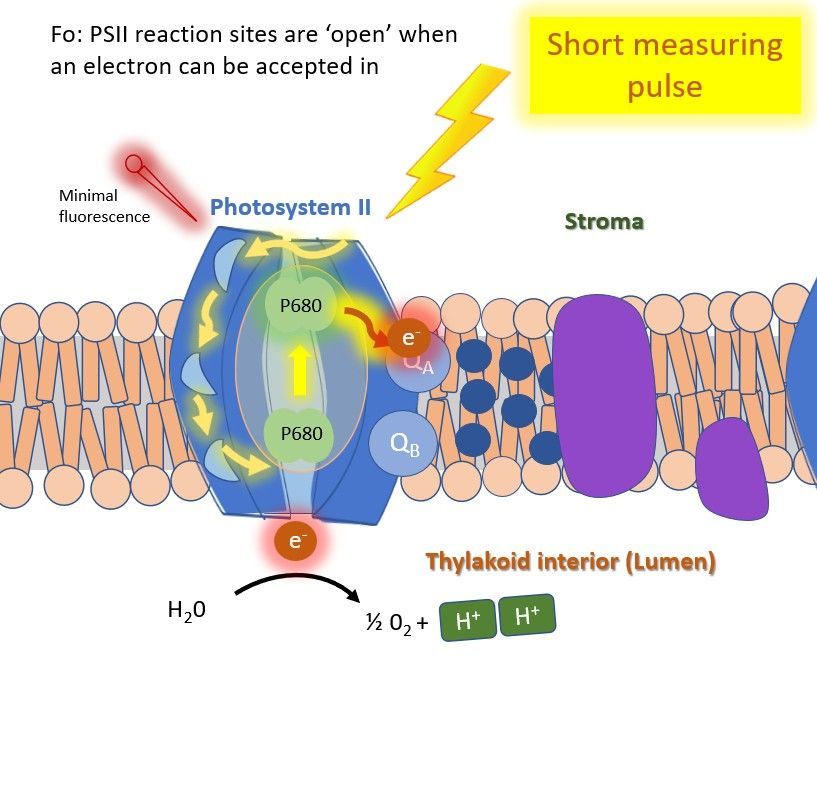
After dark adaptation, the base fluorescence level (Fo) is measured using the very short measuring-light pulses (Figure 2). The Fo reflects the minimal fluorescence level emitted by PSII when all reaction centers are 'open'. The light pulses are so short that no energy transfer occurs in the reaction center beyond fluorescence emission and minimal photosynthesis.
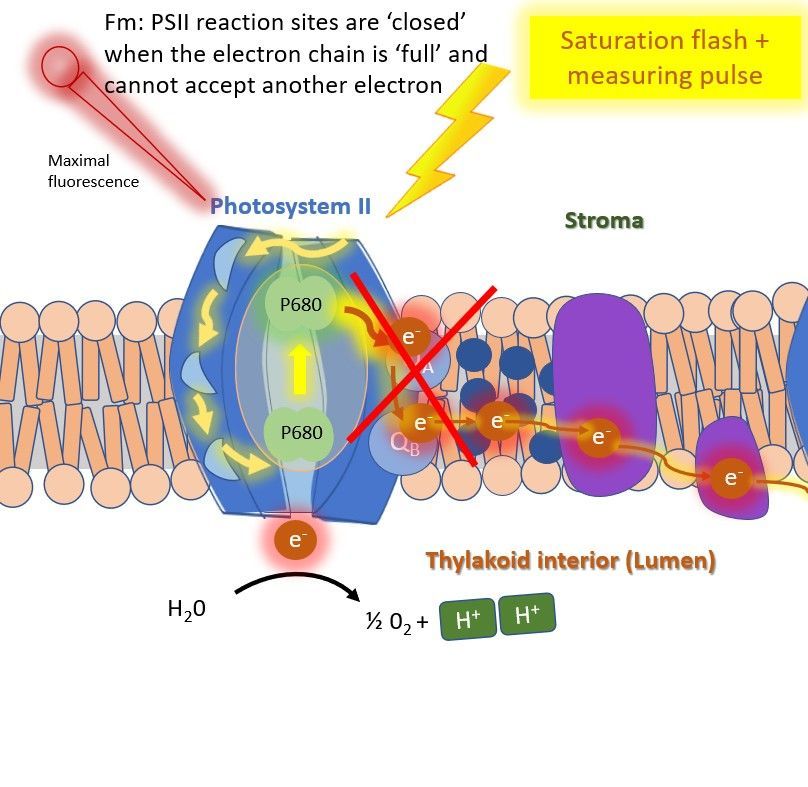
Next, a saturation light pulse (>6000 μmol m2 s1; which is 3 times the intensity of the sun) is applied to fully saturate the photosystems. The photosynthethic processes have to adapt to this extreme light, but this takes some time. The system is flushed with electrons, effectively clogging the chain, shortly blocking photosynthesis. As energy can not flow towards photosynthesis anymore during this time, fluorescence yield increases to a maximum; Fm (remember the three fates of energy) (Figure 3). This measurement is done in dark adapted plants, because other energy transfer processes (heat dissipation: NPQ) must be zero.
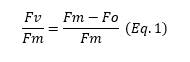
The difference between Fo and Fm, known as Fv, is expressed relative to Fm (Equation 1), which calculates the potential maximum efficiency of PSII. This value represents the potential maximum efficiency because no other competing processes are active during the measurement.
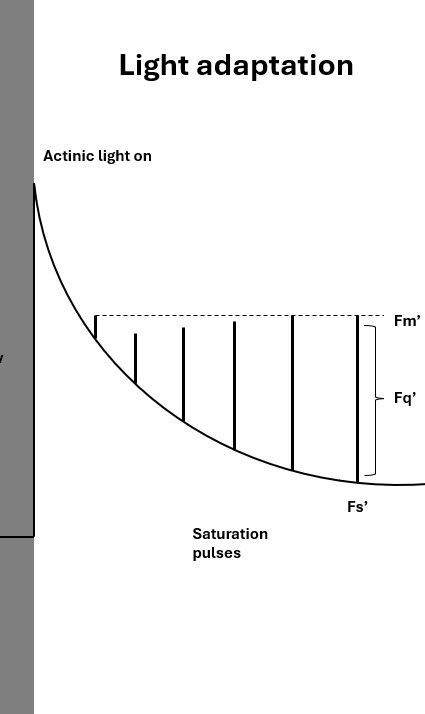
PAM - Light Adaptation Measurement
To measure a plant's adaptation to light, actinic light is turned on at a specified intensity. The actinic light induces photosynthesis. During the actinic period, multiple measurements (with measuring- and saturating pulses) are taken to assess the quenching processes happening in the plant.
The values of minimal and maximal fluorescence measured in the light are named differently than in the dark, namely: Fs' and Fm' (Figure 2). The difference between Fs' and Fm' is called Fq'.
The behavior of the line is reflecting the plant's adaptation process. Under light conditions, the plant cannot use all light energy for photosynthesis (see introduction blog), and therefore also initiates processes to safely dissipate excess energy, called non-photochemical quenching (NPQ). NPQ increases when a plant is adapting to light, which is why the line is sloped. Eventually, fluorescence yield reaches a steady state.
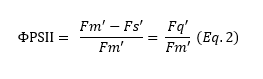
From the values of Fq' and Fm', the actual photosynthetic efficiency (called ΦPSII) can be calculated (Equation 2).
Using ΦPSII, the electron transport rate (ETR) can be calculated (Equation 3). ETR is a widely used parameter in plant science, with its main advantage over ΦPSII being that it incorporates light intensity and light absorption rate, making it more representative of actual photosynthetic activity in a given environment. It is highly correlated with actual carbon fixation.
ΦPSII alone can be beneficial in controlled conditions (where light intensity is fixed), or when comparing relative efficiencies across treatments, as it remains a simpler assessment that does not require light intensity and light absorption measurements.
where alpha (α) is the absorbance of the leaf, PSII ratio (β) is the proportion of light absorbed by PSII, and actinic light intensity (I) is the photosynthetic photon flux density (PPFD) of the actinic light in μmol m-2s-1.
NPQ is calculated by comparing the maximal fluorescence in the light (Fm') with the maximal fluorescence in the dark (Fm):
Dark Recovery
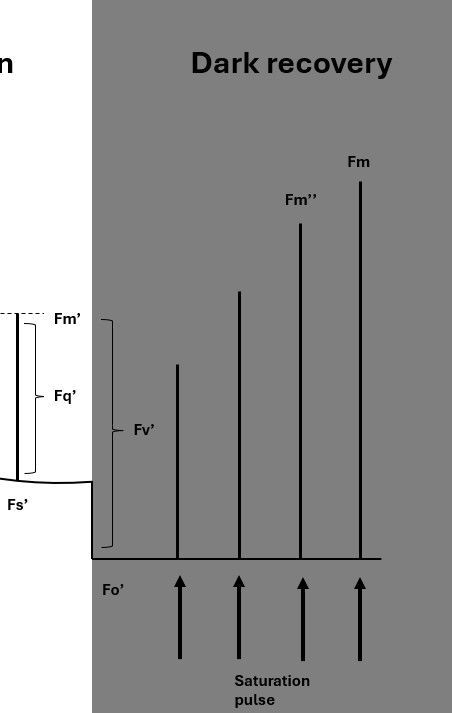
In the dark, after a period of illumination, the plant gradually recovers (or ‘un-quenches’) from the absorbed light energy. This recovery can be monitored to provide insights into different quenching mechanisms, which are characterized by fast- and slow-relaxing components.
Dark recovery can be measured using a quenching protocol, where the dark-adapted and light-adapted stages are performed consecutively. Immediately after the actinic light is turned off, a low-intensity far-red light pulse (approximately 5 seconds) is applied. This pulse ‘flushes’ electrons from the electron transport chain. Far-red light is used, because only Photosystem I (PSI) absorbs it, effectively absorbing all electrons from electron carriers in the chain.
Minimum fluorescence is measured after this treatment, and is called Fo’.
The difference between Fm’ and Fo’ is referred to as Fv’. The measurement of maximum fluorescence after the far red pulse is called Fm'' (two primes instead of one).
After collecting these values, further photochemical and non-photochemical parameters can be calculated.
Further Photochemical Quenching Parameters
Other often used photochemical parameters that are calculated are qP and qL.
qP represents an estimate of the fraction of PSII reaction centers that are open and ready for photochemistry, derived using the following equation (Equation 5):
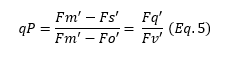
However, studies found that the correlation between qP and the fraction of open PSII centers was not always linear. This non-linearity is due to qP being based on the “puddle model”, where each PSII reaction center acts independently with its own antenna system and there is no energy transfer among different complexes (Kramer et al., 2004; Baker, 2008). Evidence suggests this model does not always reflect physiological reality (Butler, 1978; Lavergne & Trissl, 1995; Lazer, 1999; Barber, 2003; Kramer et al., 2004).
Barber (2003) showed that PSII centers form dimers within the thylakoid membrane, and subsequent work found that they are embedded in a shared antenna matrix capable of excitation-energy transfer between units (Baker, 2008). This configuration is known as the “lake model” (or “connected units model”) and is considered more representative for most oxygen photosynthetic organisms, particularly higher plants.
Based on the lake model, Kramer et al. (2004) derived a new parameter, qL (Equation 6), which more accurately estimates the fraction of open PSII centers:
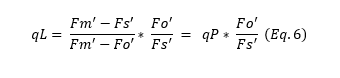
Although qL is widely acknowledged, and offers a more theoretically refined measure, its practical application and interpretation also come with complexities and some limitations (see paper). Despite the theoretical advantage of qL, qP is still often used in studies. Researchers look for relative changes or trends compared to a control and with consistent measurements, qP can still be a good indicator for stress among treatments.
Further Non-Photochemical Quenching Paramters
During dark‐recovery (un‐quenching), different non‐photochemical quenching mechanisms recover at different rates. These variations allow us to distinguish between fast‐relaxing and slow‐relaxing components. The NPQ value we have seen before (Equation 4) is a fast quenching mechanism, and also rapidly relaxes upon darkening.
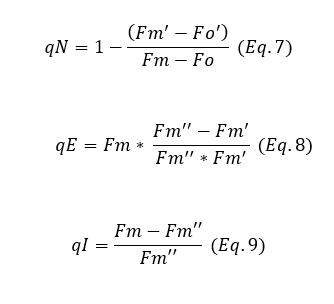
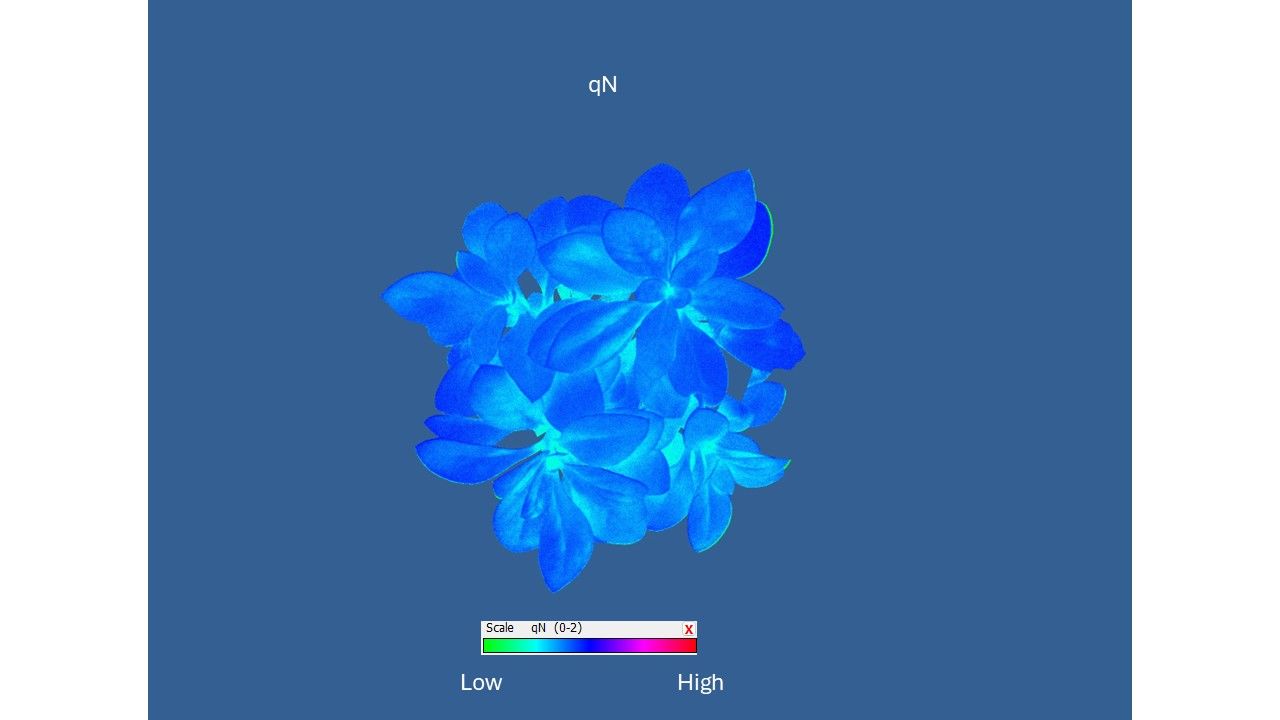
However, if a parameter is desired that includes both fast and slow quenching processes (such as state‐transitions and photoinhibition), the coefficient qN (Equation 7) can be used. This parameter effectively differentiates between these processes, as qN = qE + qT + qI.
qE (energy quenching) (Equation 8) is a fast-relaxing process that occurs within 2-5 minutes. In contrast, qI (photo-inhibitory quenching)(Equation 9) is a slow-relaxing process that can extend from several hours to days, depending on the rate of photoinhibition. This extended recovery time is dependent on the amount of damage to the PSII units that the plant must repair.
A limitation of qN is its reduced sensitivity to changes when the values are elevated, making it less responsive.
Total energy partitioning
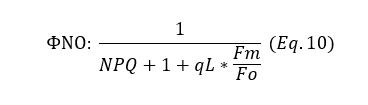
In addition to controlled energy release, some energy is emitted in a non-regulated manner. We can derive this form of energy release relative to the other forms of energy release (PQ, NPQ), to get the quantum yield. The fraction of open PSII centers (qL) is also used. The quantum yield of this non-regulated energy release is expressed as ΦNO and can be calculated using the following formula (Equation 10):
With the quantum yield of non-regulated energy release established, the quantum yield of NPQ (ΦNPQ) can be calculated (Equation 11):
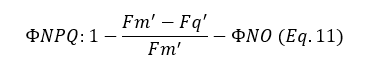
These calculations let us partition the absorbed energy into photochemistry, regulated heat dissipation, and non-regulated losses, providing valuable insight into the plant's energy distribution, since: ΦPSII + ΦNPQ + ΦNO = 1
Deriving NPQ without dark adaptation
NPQ is an important parameter when studying photosynthesis and optimizing plant efficiency. However, measuring NPQ requires determining the maximal fluorescence yield (Fm) in the dark. Dark adaptation of plants is not always practically feasible and, if done too briefly, can introduce errors. To address this, Tietz et al. (2017) proposed a method for estimating NPQ using the parameter Fo' as a reference instead of Fm. This approach leads to a new equation for NPQ:
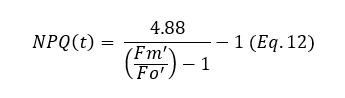
The values for NPQ and NPQ(t) are highly linear and accurate in most cases. However, the formula is based on several assumptions, which can be a limitation. These assumptions are discussed in their paper, where an overview of the potential drawbacks is provided in their discussion section.
References
- Baker, N.R. (2008). Chlorophyll fluorescence: a probe of photosynthesis in vivo. Annual Review of Plant Biology 59: 89-113.
- Barber, J. (2003). Photosystem II: the engine of life. Quarterly Reviews of Biophysics 36: 71-89.
- Barber, J. (2016). Photosystem II: the water splitting enzyme of photosynthesis and the origin of oxygen in our atmosphere. Quarterly Reviews of Biophysics 49: e16
- Butler, W.L. (1978). Energy Distribution in the Photochemical Apparatus of Photosynthesis. Annual review of plant biology 29: 345-378.
- Kramer, D.M., Johnson, G., Kiirats, O. and Edwards, G.E. (2004). New fluorescence parametesr for the determination of QA redox state and excitation energy fluxes. Photosynthesis Research 79: 209-218.
- Lavergne J. and Trissl, H-W. (1995). Theory of Fluorescence Induction in Photosystem II: Derivation of Analytical Expressions in a Model Including Exciton-Radical-Pair Equilibrium and Restricted Energy Transfer Between Photosynthetic Units. Biophysics Journal 68: 2474-2492.
- Lazár, D. (1999). Chlorophyll a Fluorescence Induction. Biochimica et Biophysica Acta (BBA) - Bioenergetics 1412: 1-28.
- Tietz, S., Hall, C.C., Cruz, J.A. and Kramer, D.M. (2017). NPQ(T): a chlorophyll fluorescence parameter for rapid estimation and imaging of non-photochemical quenching of excitons in photosystem-II-associated antenna complexes. Plant, Cell & Environment 40: 1243-1255.
- Zavafer, A., Labeeuw, L. and Mancilla, C. (2020). Global Trends of Usage of Chlorophyll Fluorescence and Projections for the Next Decade. Plant Phenomics 2020: 1-10.