The New CF2GO
In June, the CF2GO (Chlorophyll Fluorescence 2 Go) was officially launched at the Greentech conference in Amsterdam in the Netherlands, and was nominated out of 47 products for the innovation award by the jury!
The CF2GO is our newest camera system capable of measuring real-time efficiency of photosynthesis and plant stress from a distance by capturing chlorophyll fluorescence signals. Its ability to operate 1 meter away from the plant with high accuracy sets it apart from traditional sensors, that often work with leaf clippers. With the CF2GO, we bring the same scientific quality and accuracy as our other systems to the greenhouse.
The information that lies in chlorophyll fluorescence has been studied over the last 80 years at universities and research groups. The past ~20 years, this fundamental research has been implemented in practical applications that are used in agriculture (mainly by large breeding companies, multinationals and universities). The integration of this technique into a camera system with a small body that can measure from afar is novel, and marks a new step in the usage of photosynthesis sensors as it makes its way into greenhouses.
With real-time data on efficiency of photosynthesis and stress indicators, deeper insights into crop performance can be obtained, enabling more informed decisions in cultivation practices. The camera can be mounted either stationary, or on for instance a robotic arm that moves throughout the greenhouse.
The CF2GO is already operational in four commercial greenhouses (two for validation and fine-tuning of the product). In the magazine 'In Greenhouses', or 'Onder Glas' in Dutch, cultivation manager Johan Langelaan from Maarel Orchids explains why they started integrating the CF2GO in their cultivation. He explains: "We can now see in real-time when the plants require more or less light for photosynthesis, allowing us to adjust screening and lighting immediately. We can do this without fear of potential damage from too much or too little light. This way, we get more out of the crop and can grow with greater confidence". Another important advantage they mention is that no interpretation is required: “because you get hard facts and measured values from the system, and you can immediately see what they mean”.
Maarel Orchids is now actively working on integrating the measurements with the climate computer to automate lighting and shading controls, which is something that is mostly done manually still.
The article can be found at:
https://www.onderglas.nl/gewas-krijgt-exact-de-hoeveelheid-licht-die-het-nodig-heeft/
In this blog, I will explore the technical specifications of the CF2GO and how it captures its measurements. I will also showcase data from experiments and real-world examples from greenhouses, demonstrating what photosynthesis and stress data look like and how this information can be used to optimize cultivation practices.
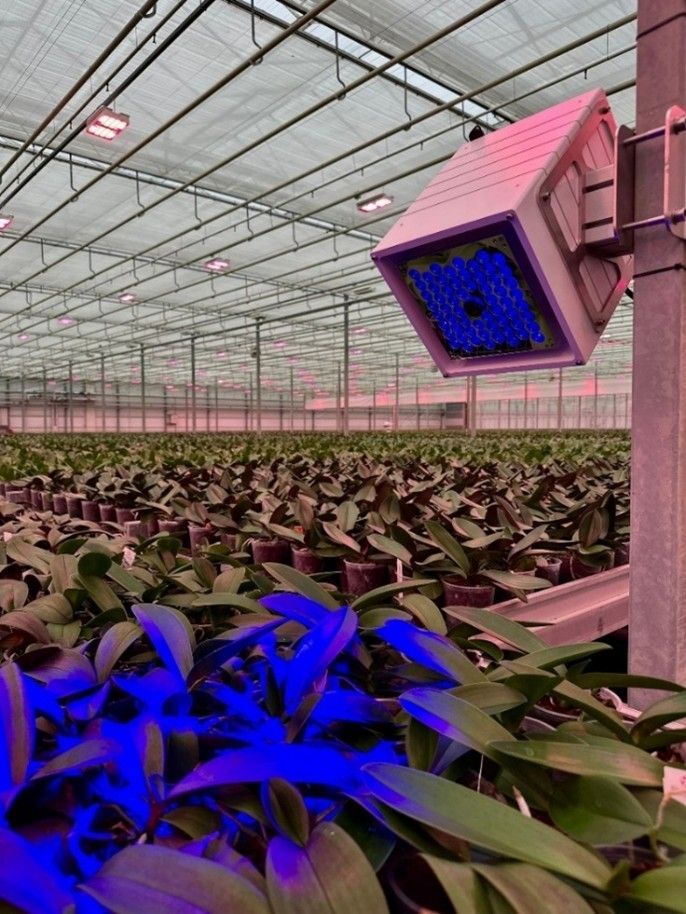
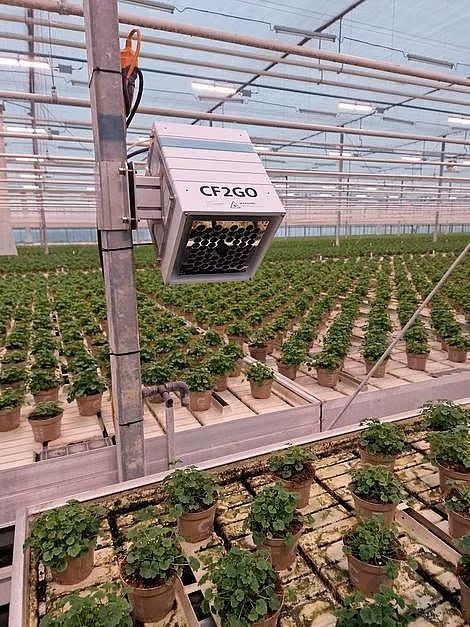
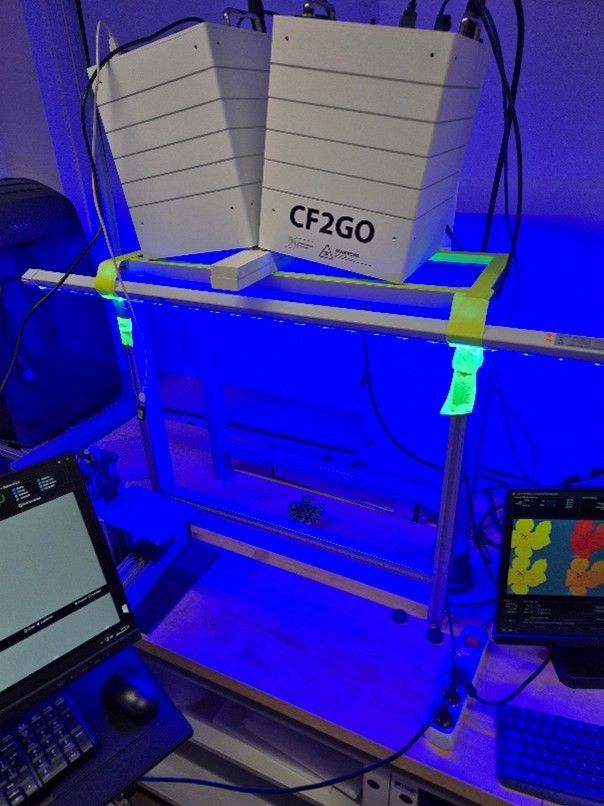
Figure 1: Two of the CF2GO's mounted in two different commercial greenhouses.
Technical specifications CF2GO
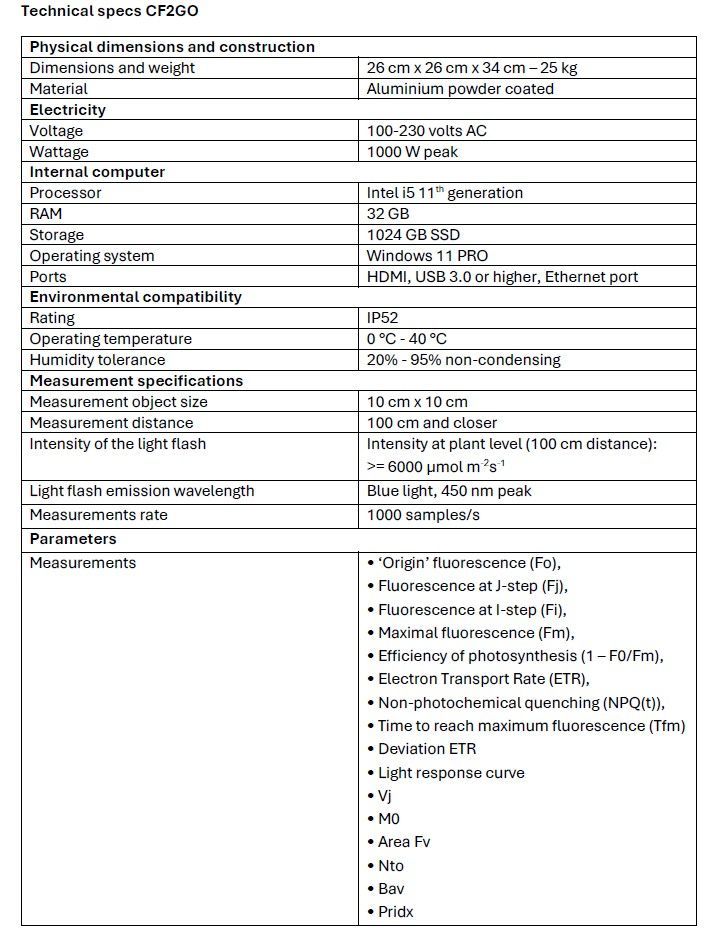
Hardware - build quality
The CF2GO is constructed from a solid aluminium frame, in which all the components (light sources, camera, filter, sensor, computer) are integrated in an air- and dust free environment. The system is cooled by thermal bridges that protect the critical components from dust and moist. The housing frame is made from powder coated aluminium, which can withstand the fluctuating environmental conditions in the greenhouse, making it very durable.
Software
The control software runs on the internal computer to capture different images using pre-installed protocols. The gathered data is transmitted to MyLegnd for interpretation (see next section). The software also has a remote-control feature, enabling integration with other systems, such as phenotyping platforms. Additionally, data can be accessed via an Application Programming Interface (API), allowing for the development of customizable automated programs (for example for direct communication with a climate computer).
Data interpretation
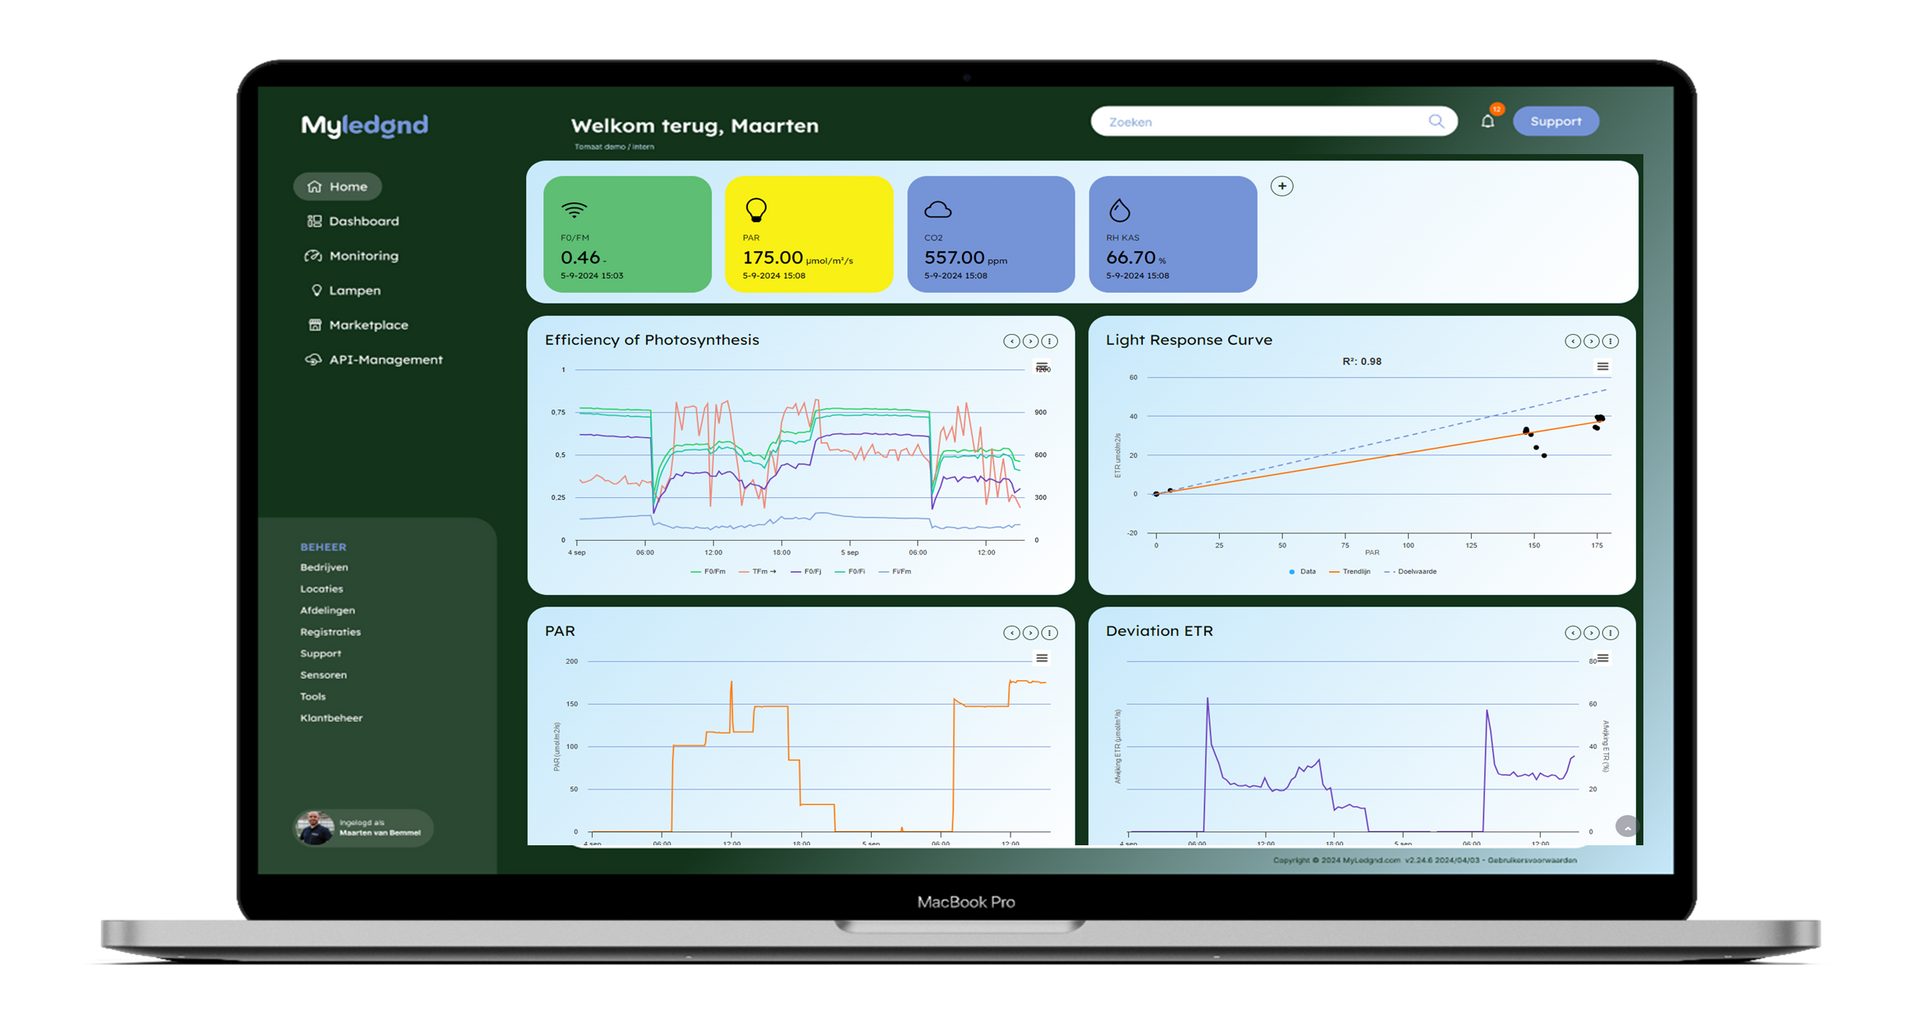
The data collected by CF2GO is integrated into the MyLegnd user interface (Figure 2), where the values can be observed simultaneously with other vital parameters from other sensors to get a comprehensive overview of important greenhouse data. These other parameters include PAR light intensity, temperature, humidity, CO₂ concentration, transpiration, light response curves, and more.
Later in this blog, I will highlight some of the key parameters provided by the CF2GO.
If needed, data and graphs can be downloaded for further personal use. Additionally,
datasets can be stored locally on the CF2GO's internal computer for up to 5 years.
Calibration
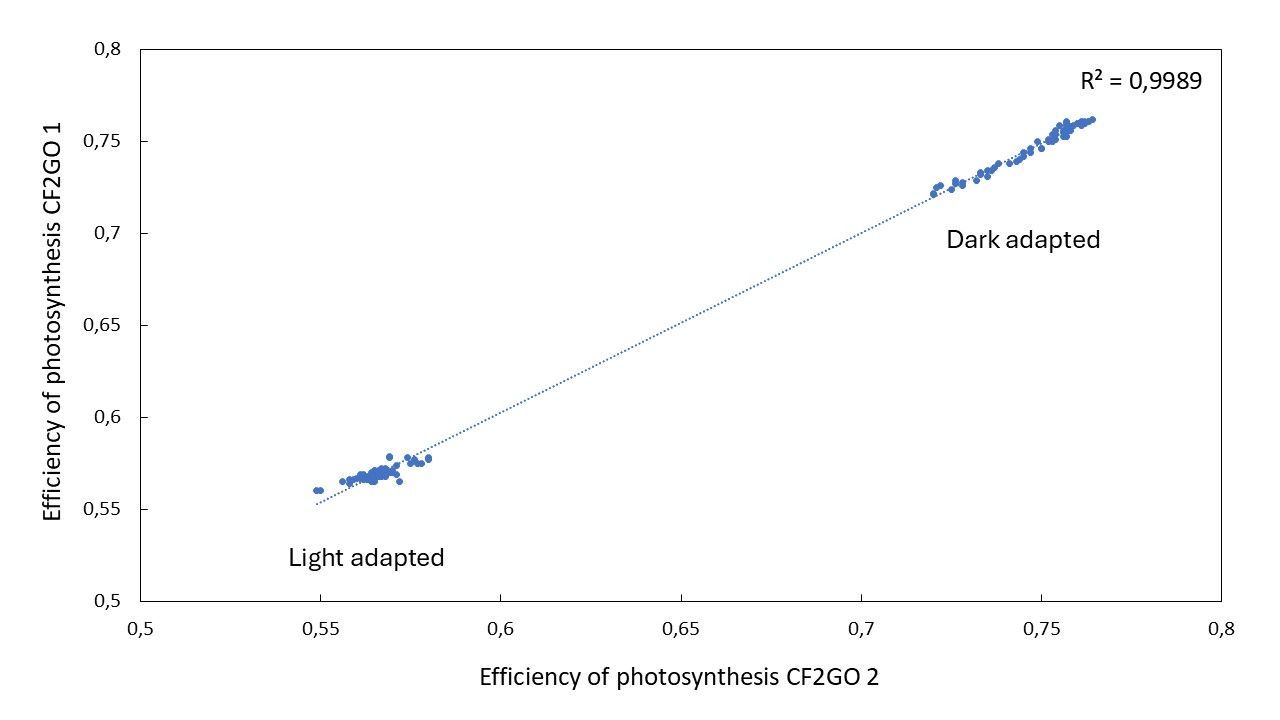
To ensure reliable and accurate data, the CF2GO systems are carefully calibrated before shipping. Calibration is essential for all electronic measuring devices to minimize electronic noise and reduce variability between units, regardless of the type of measurement.
In experiments testing the CF2GO systems (Figure 3), we observed that the variation between the devices after calibration was extremely minimal: 0.22% difference, with a correlation coefficient (R²) of 0.9989 (Figure 4).
Theory
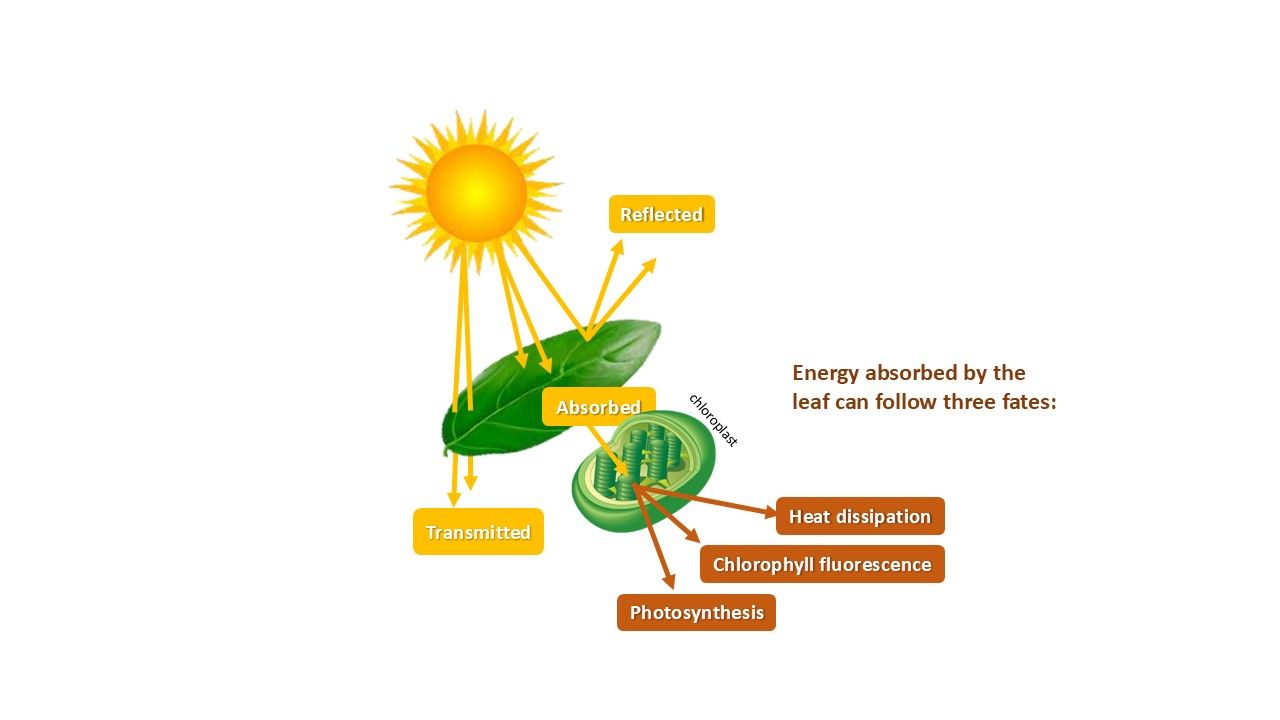
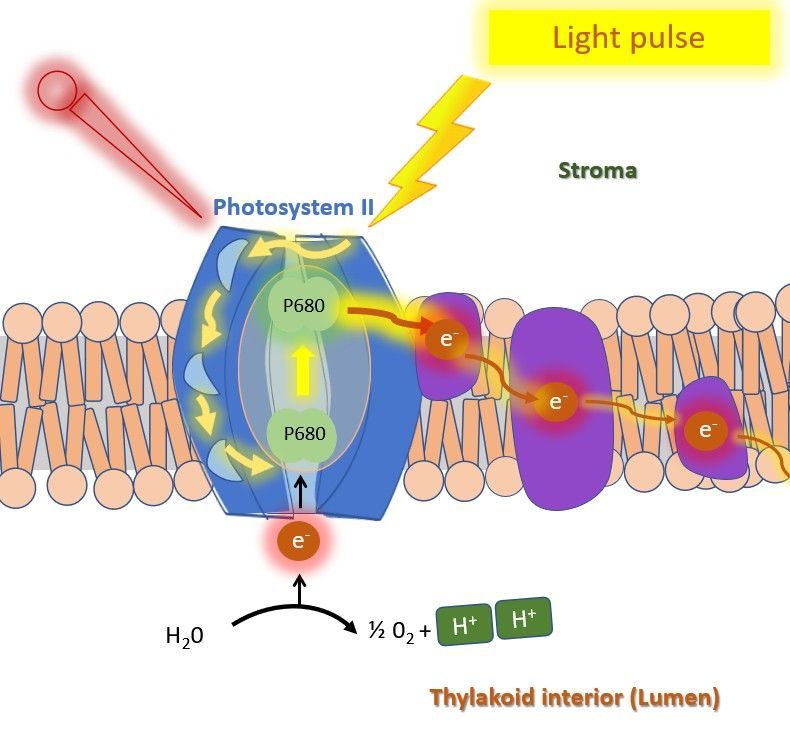
Figure 5 shows the pathway of sunlight at the leaf. After absorption of light in the leaf, much of the energy is directed toward photochemistry (1), but not all. A portion of the energy is dissipated as heat (2) or emitted as fluorescence (3). These three possible pathways always happen simultaneously, and are in direct competition with each other, meaning an increase in one results in a decrease in the other. This phenomenon allows us to calculate photosynthetic efficiency, and the other energy pathways.
The CF2GO measures photosynthesis and stress using a protocol known as the fast chlorophyll a fluorescence rise (also known as the OJIP method). This method records chlorophyll fluorescence over the course of a single 1-second light flash.
Fast chlorophyll fluorescence rise (OJIP measurement)
The light flash during the protocol has a very high blue light intensity of at least 6000 μmol m-2 s-1 at 100 cm distance. This intense light (3 times the intensity of the sun) is required to fully saturate the plant’s photosystems (see introduction blog), a critical step for capturing accurate and reproducible fluorescence signals and calculating key photosynthetic parameters.
During the 1-second light pulse, fluorescence signals from the plant rise, and the camera tracks this increase with the 1000 frames it takes within this 1 second. The resulting graph produces a characteristic double-S-shaped curve with two distinct plateaus during the rise, termed the J plateau and I plateau—hence the name OJIP (Figure 6).
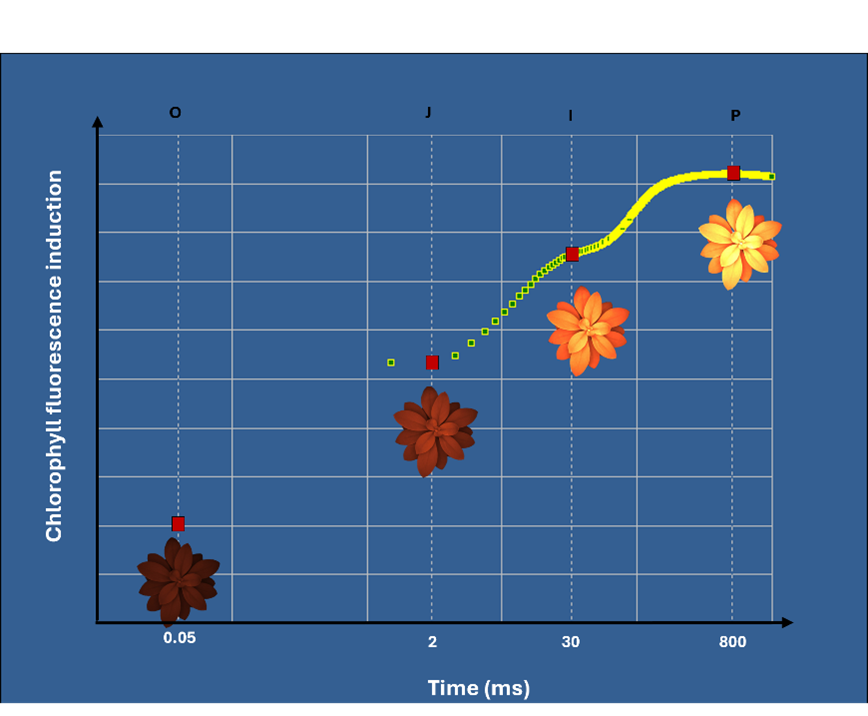
The “O” step represents the “origin”. The “J” step appears within 2 milliseconds, followed by the “I” step at approximately 30 milliseconds, and finally, the “P” step marks the “peak” or maximum fluorescence (when all photosystems are closed due to high light energy, see figure 7).
The difference between minimal and maximal fluorescence provides information about the functioning of the photosystems of the plant (photosynthesis), and the plateaus in the curve reflect specific electron flow dynamics of in the photosynthetic process.
Tracking these processes provides insights into the photochemistry and energy pathways occurring within the plant. These processes are highly sensitive to environmental and biological stresses, such as water stress, heat stress, nutrient deficiencies, pests, or diseases. This sensitivity makes the OJIP protocol an effective tool not only for understanding photosynthesis but also for detecting plant stress early (before anything can be seen on the plant by eye).
For more in depth information about the OJIP method, or the specific proteins within the thylakoid membrane where these processes happen, the following papers can give nice insights:
Key parameters measured by the CF2GO, and the effect of stress
Efficiency of Photosynthesis
This parameter measures the efficiency of the PSII-photosystems, which are driving photosynthesis (see introduction blog). It represents the fraction of the light energy absorbed that is used to drive photosynthesis. (Sudden) reductions in the efficiency of photosynthesis can be seen as a sign of stress.
A healthy plant has a stable potential photosynthesis efficiency during the night, typically around 0.75-0.84. These values in the night represent the plant’s potential maximal capacity to use light for photosynthesis when all processes are fully relaxed, and all photosystems are open (dark adapted).
During the day, efficiency of photosynthesis values tend to drop. This is because the amount of light energy captured by the plant is more than what it can use for photosynthesis. To prevent light damage, some of that energy is actively released by the plant as heat (called non-photochemical quenching) which, as an effect, lowers the overall efficiency of photosynthesis during the daytime (remember the three possible pathways of energy).
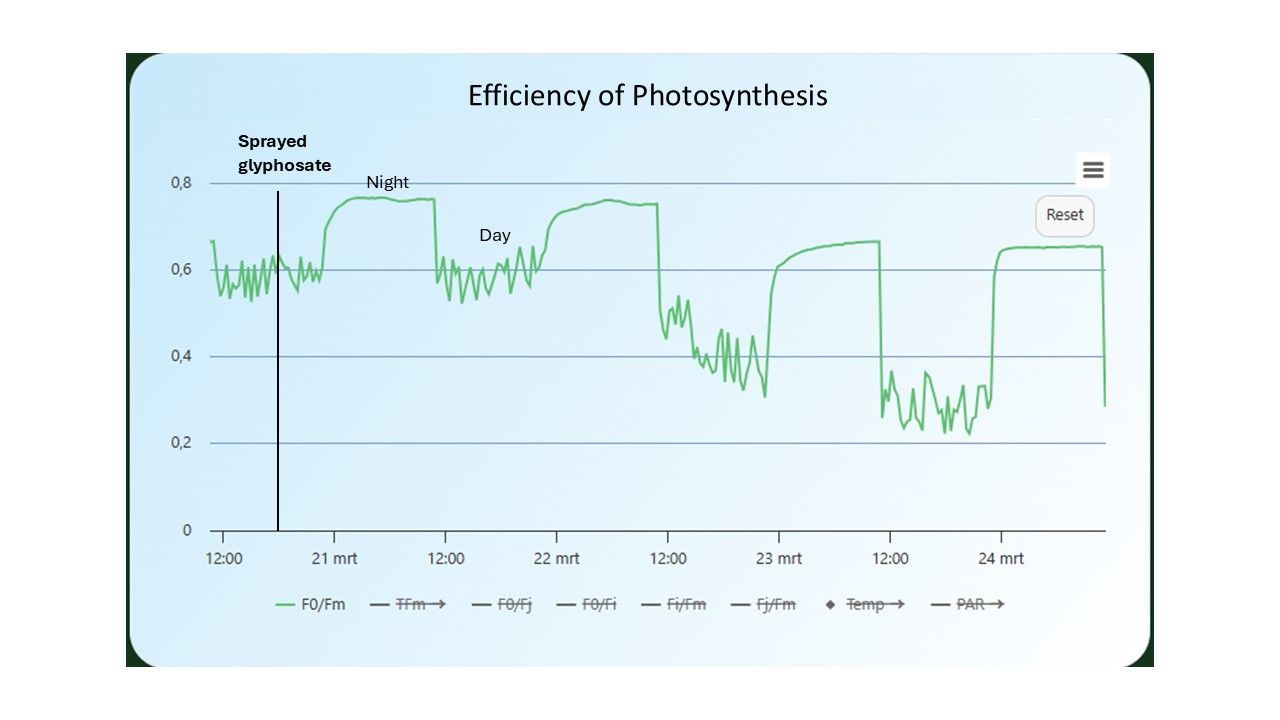
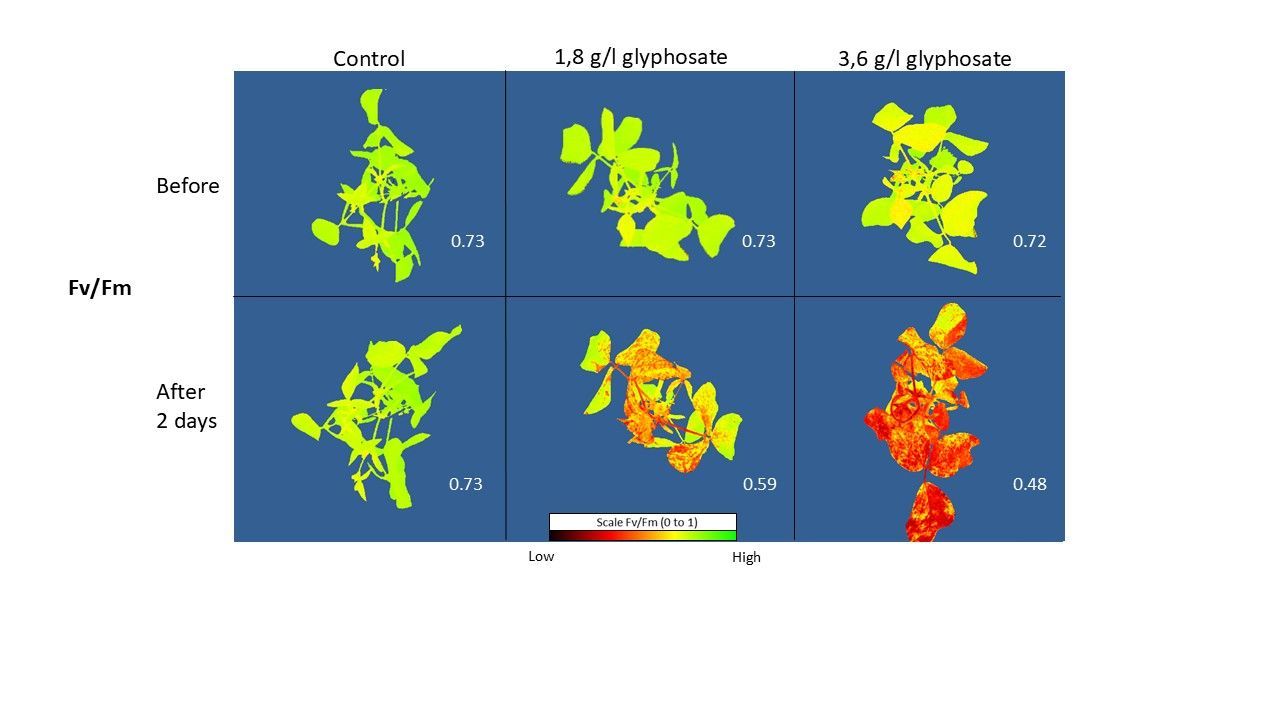
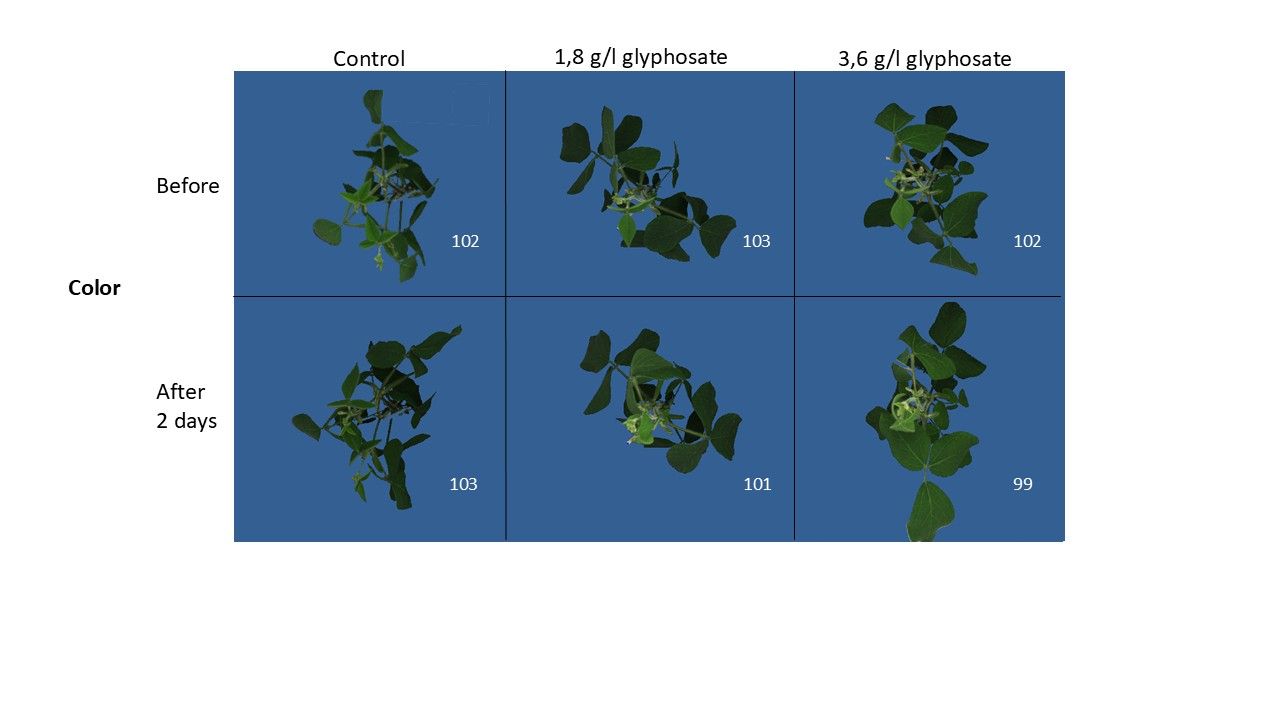
In figure 8, the efficiency of photosynthesis is tracked on a soybean plant that had been sprayed with glyphosate (herbicide). The second day after spraying, a drop in the values can be seen (from 0.6 to 0.4 during the day, and from 0.75 to 0.65 during the night). While this happened, visual symptoms could not be seen on the plant. Visual signs of stress, such as changes in color, appeared only after 4 days (in this case shown as decrease in HUE, indicating yellowing of the leaves; figure 9). Of course, glyphosate is specifically designed to kill plants quickly, making death inevitable. However, in the case of other stressors, such early detection could provide a critical window for intervention, preventing stress or damage and increasing yields.
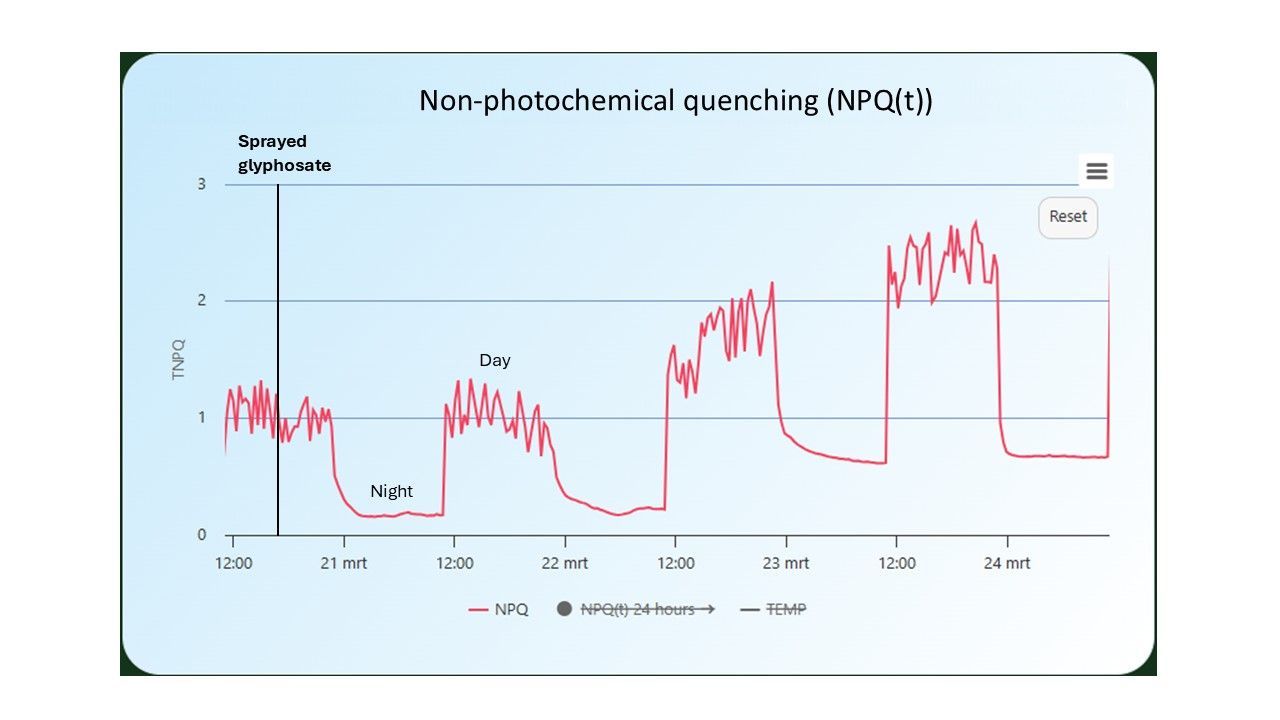
NPQ(t)
Not all light energy can be used by the plant for photosynthesis, which forms a problem for plants because the energy has to go somewhere. Uncontrollable energy can react with molecular oxygen, generating an excited state of oxygen known as 'reactive oxygen species (ROS), which is very harmful for plants and causes cellular damage. Hence, plants have developed protection mechanisms to actively manage the energy dissipation, called Non-Photochemical Quenching (NPQ). NPQ is the process of active controlled discarding of the excess energy as heat to avoid damage in the photosynthetic apparatus.
NPQ is a dynamic process and fluctuates based on the light intensity and the health of the plant. NPQ is always present under light conditions. However, (sudden) strong increases in NPQ values in combination with dropping photosynthetic efficiency values points to stress. This response suggests that the plant is absorbing more light energy than it can use for photosynthesis, and is activating its protective mechanisms to prevent damage.
In figure 10, the plant that had been sprayed with glyphosate showed increasing NPQ(t) values.
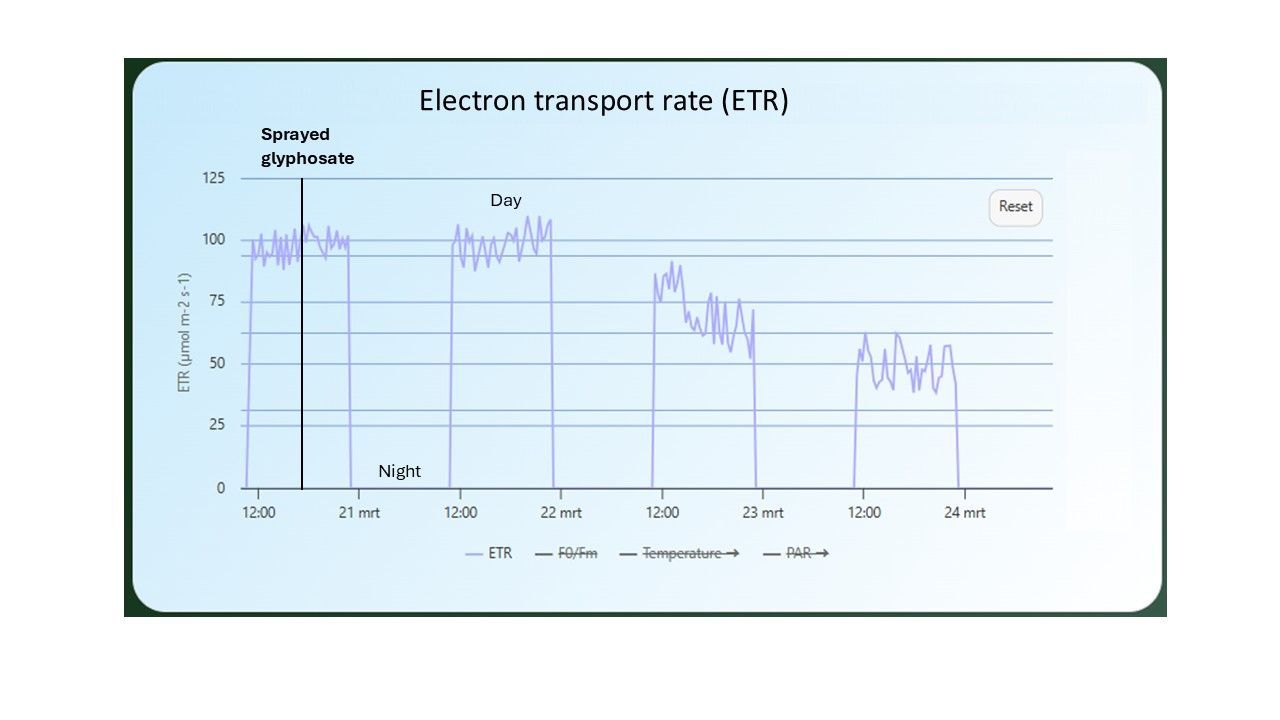
Electron Transport Rate (ETR)
provides an estimate of the speed at which electrons are transferred in the electron transport chain of the photosynthetic apparatus. This value is positively correlated with the photosynthetic activity of a plant and CO2 assimilation (when the stomata are open) and is a widely used parameter for gaining insight into the plant’s processes and stress responses.
An important advantage of ETR compared to the photosynthesis efficiency value is that it also takes light level (PAR) and light absorption into account in the calculation. This provides a better understanding of the actual photochemical activity in relation to (fluctuating) environmental factors.
The higher the ETR value, the faster the electrons are transferred in the electron transport chain. Also here, sudden drops in ETR, especially under constant light conditions, can point to stress.
On the second day after spraying glyphosate on the soybeans, a significant drop in ETR was observed (Figure 11).
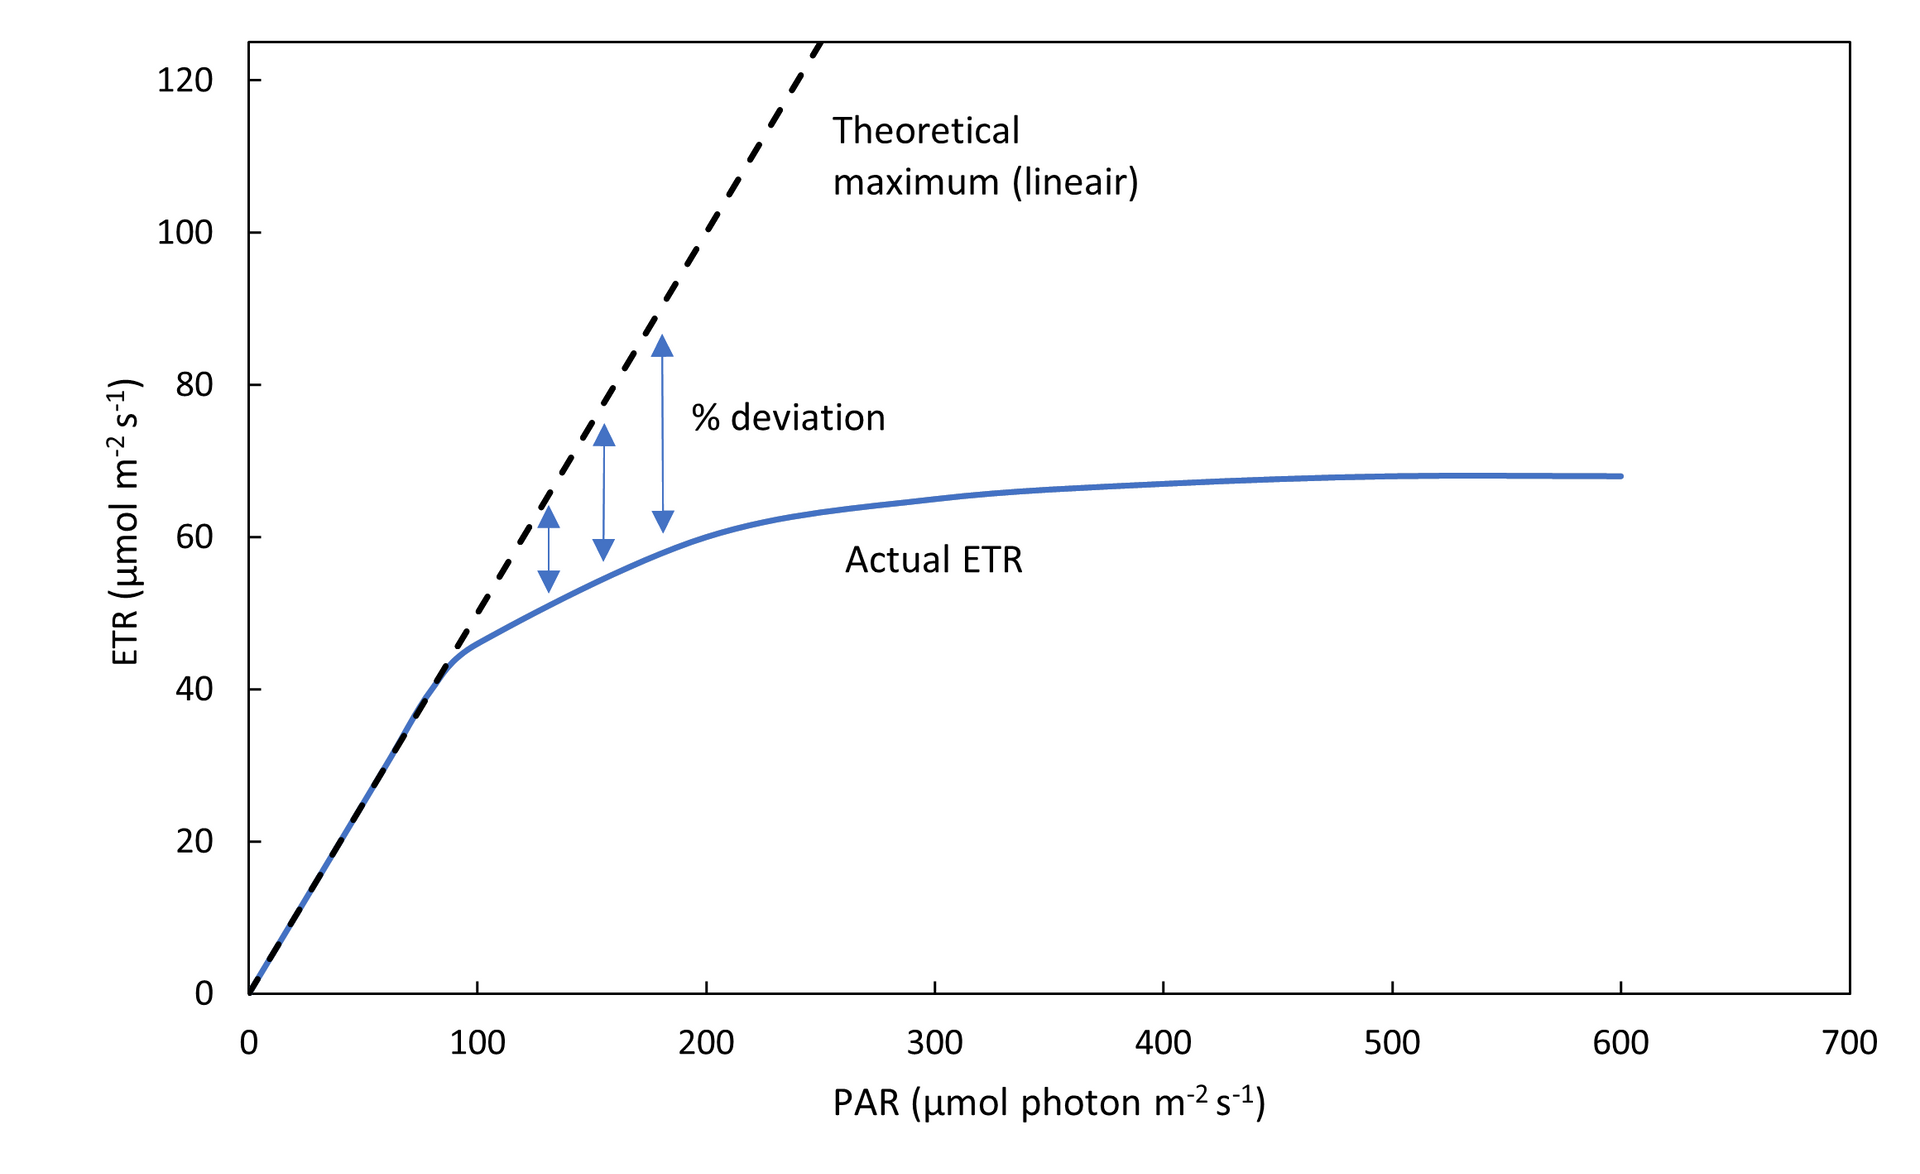
Deviation ETR
is an indicator that shows how far the measured ETR deviates from the theoretical maximum that could be achieved under ideal, non-limiting conditions. The theoretical maximum is a value that increases linearly (Figure 12). However, in practice, the ETR can never increase linearly indefinitely because factors like CO2 uptake become limiting, and the plant becomes saturated with light. The greater the deviation from the theoretical maximum, the less efficiently the plant uses the light at that specific intensity.
Typically, a threshold value is determined, which is crop-specific, within which the values should fall.
A sudden rise in ETR deviation indicates that something is wrong. In stressed plants, the ETR deviation becomes significantly larger because stress negatively affects the speed of electron transport, causing the measured ETR to remain lower than theoretically possible at that light level (and thus increasing the deviation).
Experiment with Phalaenopsis plants (CAM) in a controlled environment
To understand how the CF2GO measurements can be used, we conducted experiments on different plants. One of these experiments was with phalaenopsis plants.
Phalaenopsis is a CAM plant, which absorbs CO₂ at night and stores it as malate. During the day, the plant closes its stomata and the stored malate is used to release the trapped CO₂, which is then utilized to sustain photosynthesis. A key challenge for growers is to apply optimal lighting according to the malate release. As phalaenopsis is a shadow plant, too much light can induce damage (like leaf yellowing), and too little influences yield.
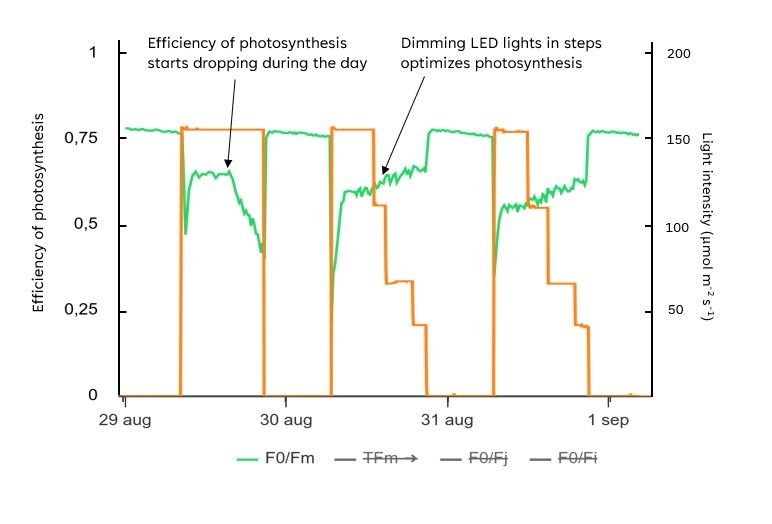
In an experiment where we kept the light levels constant, we observed a decline in photosynthetic efficiency at the end of the light period (Figure 13). We believe that this reduction was due to the depletion of malate, leading to insufficient CO2 availability within the plant to run photosynthesis.
Since photosynthesis was less efficient in the afternoon, providing full light was wasteful, and potentially harmful for the plants. Therefore, we reduced the LED light intensity in steps during this time and, as hypothesized, observed an increase in photosynthetic efficiency.
Examples from the greenhouse
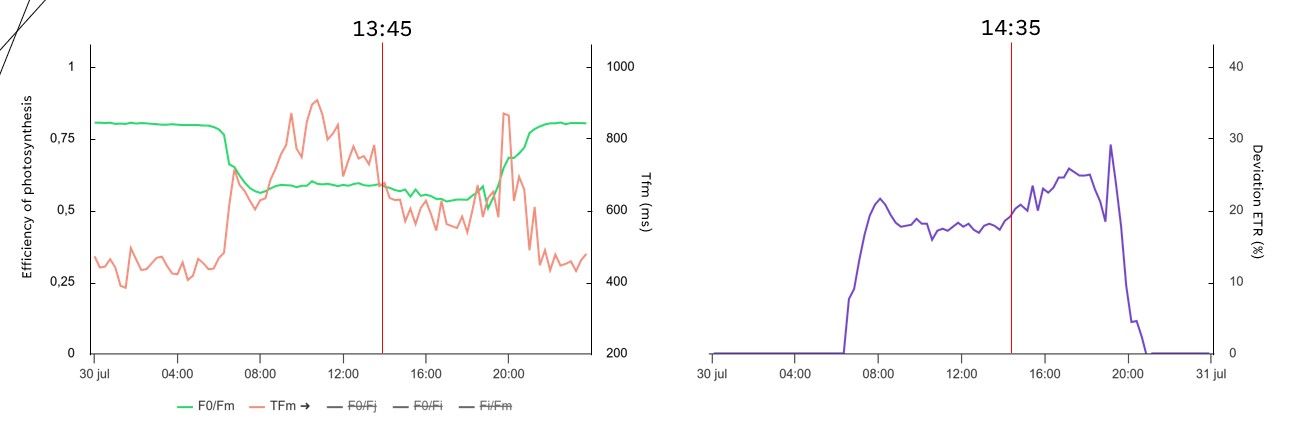
In a greenhouse with phalaenopsis, we saw the same effect as the controlled experiment: a slight drop in efficiency of photosynthesis in the afternoon (Figure 14). Consistent with the drop in efficiency of photosynthesis, the deviation ETR increased. One hour before the drop in efficiency, the time it took to reach maximum fluorescence was already decreasing. Based on these values, the grower takes action by screening more or scaling down the supplemental lighting.
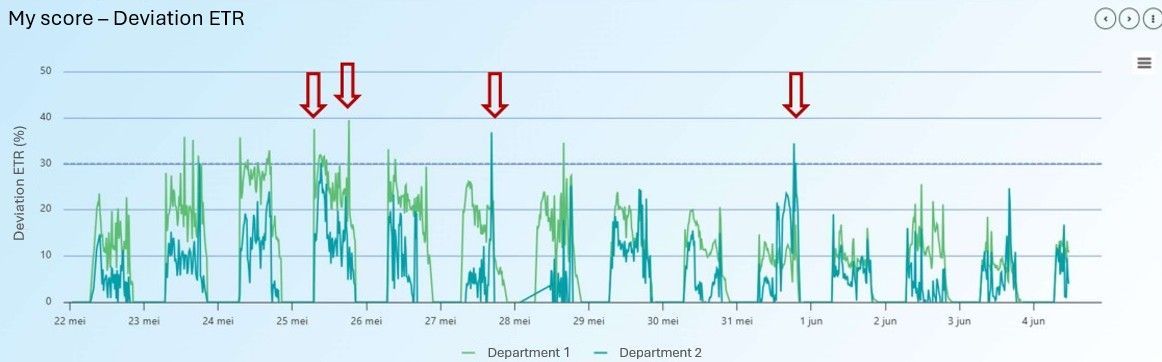
In this greenhouse, they also work with the parameter deviation ETR (Figure 15). They set a threshold of 30%. On several occasions, the deviation ETR peaked above the threshold (see red arrows). This was likely caused by sudden full sunlight reaching the plants on a partly cloudy day, where the shading screens were not closed. This is critical for phalaenopsis plants, as the high-light intensity can damage the plants. The changing conditions during a partly cloudy day are challenging to manage, because they occur quickly and last for a short duration. Sometimes, the stress that this gives can persist for several hours or even days, because of the photodamage to the PSII systems that the plant needs to repair.
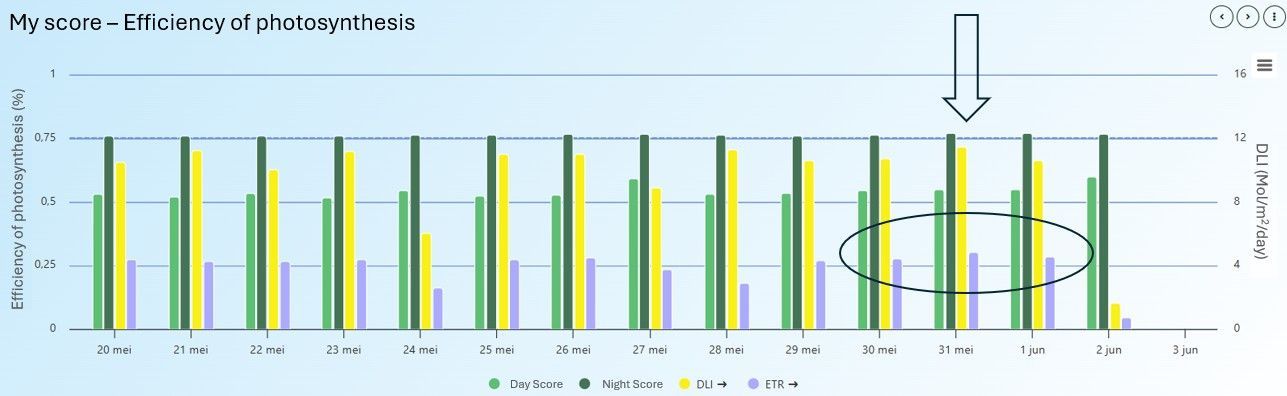
In another greenhouse, this time with potted plants, the efficiency of photosynthesis was plotted alongside DLI and ETR in the MyLegnd interface (Figure 16). From this data, we saw that the cultivation was going well, according to the stable efficiency of photosynthesis levels.
On May 31, the ETR was at its highest point. On this day, a significant amount of light was available (high DLI), and photosynthesis was also efficient. Furthermore, this was the hottest day, but the conditions were not stressful for the plants. The increase in temperature likely allowed the plant processes to occur more quickly and efficiently.
This information gives the grower a better understanding of what his plants can handle and when conditions become stressful. The following day, on June 1st, the DLI was lower, but the ETR remained high. The day after, the DLI was much lower, which also resulted in a low ETR.